Do you feel uncomfortable buying a stock? You’ve conducted your research, analyzed the charts, and evaluated the overall market conditions. Despite this, the occasional losses still make you uneasy because there are no guarantees. This article will show you how to make more informed decisions that lead to better outcomes. Read and discover 5 secrets that can transform your approach to investing in the stock market.
1. DETERMINE RISK AND REWARD RATIO

How do you decide what’s a safe amount to risk for a potential gain? For every investment, setting a risk and reward ratio that aligns with your comfort level is crucial. For the PHM stock, the ideal risk and reward ratio is targeted at 0.33. This means aiming to gain three dollars for every dollar risked. Why is this significant?
- Stop Loss: $103.15
- Profit Target: $129.28
- Potential Profit (Position), %: 19.82
This approach ensures that my potential earnings significantly outweigh my risks, adhering to the principle of a 0.33 risk/reward ratio as a maximum which helps in making grounded and lucrative decisions. In this example, the ratio was 0.21. Isn’t it better to enter a trade knowing exactly how much you stand to gain versus what you could lose?
2. CHECK OUT THE RS LINE TREND

And what about the RS line? Understanding the performance of a stock relative to its market is key to identifying strong buys. The RS line being up shows PHM is outperforming, an encouraging sign for investors.
- RS Line Trend: Up (U)
- RS Rating: Started at 94
This strong indicator suggests that the stock is likely to continue its upward trajectory, but it’s also a reminder to stay vigilant. Can you afford to overlook such a critical metric?
3. DETERMINE YOUR EXIT PRICES
When the stakes are high, how do you protect your investment? Setting strict exit prices is a fundamental strategy to safeguard investments.
- Position Risk, %: 4.21 (Never more than 8%)
- Stop Loss: Adjusted based on a 3% to 5% risk when the stock is in an uptrend
This method protects from severe downturns, ensuring that even if the market takes an unexpected turn, the losses won’t decimate your portfolio. How comforting is it to have these safeguards in place before the storm hits?
4. RAISE A STOP-LOSS TO SECURE PROFITS
Imagine your stock has appreciated by 10%. What’s your next move? Raising the stop-loss to the breakeven point or even to a point where it locks in some profit is prudent.
- Position ROI, %: 0.87
This tactic turned a good situation into a risk-free one, allowing me to relax a bit more about my investment. Isn’t securing a win just as important as choosing the right stock?
5. TIME YOUR PURCHASE
Finally, timing is everything. Knowing when to buy can be the difference between a profitable trade and a regrettable one.
- Reason for Opening Trade: Bought when the stock rebounded from key moving averages
This strategic timing maximized the potential for gains, demonstrating the importance of patience and precision in stock trading. What better way to enhance your trading success than timing your entry to perfection?
Results and Reflections
- What Went Well: Executing stop-loss adjustments ensured a profit despite market downturns.
- Lessons Learned: The critical importance of timing and market signals cannot be overstated—each plays a pivotal role in the outcome of your investments.
Through this detailed exploration, we see how calculated decisions guided by well-established strategies can lead to successful investment outcomes. What will you adjust in your next investment approach?
details at a glance
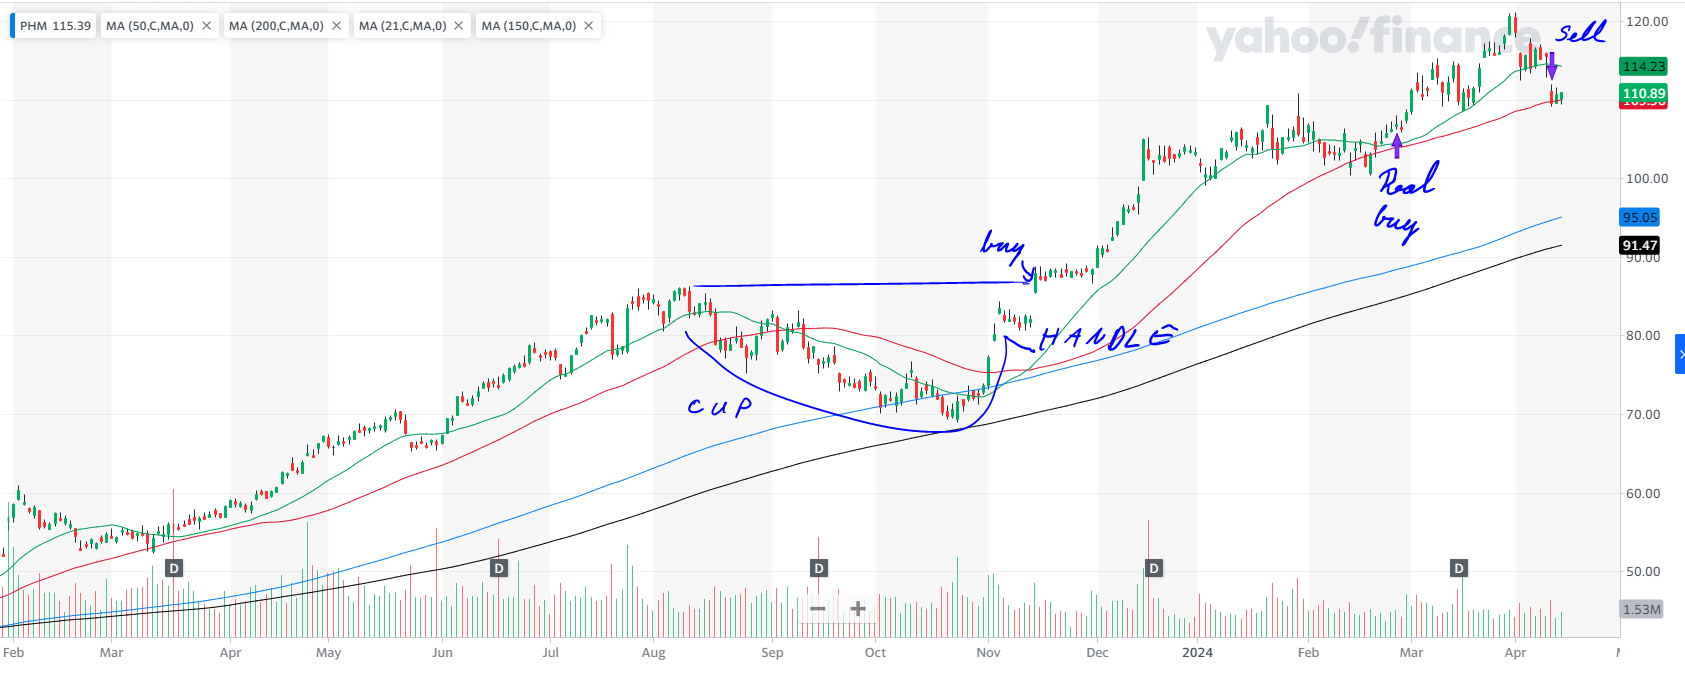
Explanations for the Drawing: The upward purple arrow shows where I bought the stock. The downward purple arrow shows where I sold it.
In the middle of the drawing, there is a cup with a handle base pattern. The correct buying point would have been when the price broke out of that base.
Green Line 21-day exponential moving average line (see EMA 21 below)
Red Line 50-day simple moving average line (see SMA 50 below)
Black LIne 200-day simple moving average line (see SMA 200 below)

Opening
- Underlying: PHM
- Date of Entry: 27 Feb 2024
- Underlying Price: $107.73
- Stop Loss: $103.15
- Profit Target: $129.28
- Market Outlook: Confirmed uptrend
- RS Rating: 94
- RS Line Trend: Up (U)
- Industry Rank: 38 / 197
- Volume U/D Ratio: 0.9
- Institutional Ownership Trend: Up (U)
- Position Risk, %: 4.21
- Position Risk to NL, %: 0.21
- Potential Profit (Position), %: 19.82
- Risk to Reward Ratio: 0.21
- Position Size, %: 5.02
- Reason for Opening Trade: Stock price had recovered and I bought it back.
- Was it an Ideal Buy?: No. The price was not coming out of the base and I didn’t check all the necessary metrics.
- Initial Remarks: I made the same mistake again! I bought the stock that was not under strong accumulation. Therefore, I raised the stop-loss higher.
Closing
- Date of Exit: 10 Apr 2024
- Closing Price: $110.68
- Market Outlook at Exit: Uptrend under pressure
- RS Rating at Exit: 91
- RS Change: -3
- Exit Remarks: The position was stopped out during a down day in the market.
Results
- What Went Well?: I bought the stock when it had bounced up from the key moving averages. I had raised the stop-loss during the trade. This guaranteed me a small profit.
- Cause of Error / IMPROVE: Again, I bought the stock that was already in an uptrend. I need to pay more attention to stocks that are trying to break out of their bases. The right time for buying would have been in November 2023.
- Lessons Learned: Things happen in the market. The position had a solid profit, but since the market conditions worsened, I was only able to realize a small part of that profit. It’s always necessary to take defensive action when market conditions worsen—raise stop-losses, lighten up your portfolio, etc. Remember, a down stock leads to a down portfolio.
- Position ROI, %: 0.87
- Position ROI (Portfolio), %: 0.04
- Position Open Time (Trading Days): 30
- Position Open Time (Days): 43
terms and definitions

EMA 21 Calculates the 21-period exponential moving average, highlighting short-term trends.
SMA 50 Averages the price over 50 periods, showing medium-term trends without overemphasizing recent data.
SMA 200 Averages the price over 200 periods, revealing long-term trends by treating all data equally.
Industry Rank Investor’s Business Daily’s system that ranks industries 1 to 197 based on performance. It guides us in CAN SLIM TRADING towards leading sectors.
U/D Ratio Measures stocks closing up versus down. A ratio above 1.0 indicates bullish sentiment, important in CAN SLIM TRADING.
RS Rating Ranks a stock’s performance on a 1 to 99 scale. I look for at least 85, showing strong momentum and growth potential.
RS Line Compares stock price to the market, plotted as a ratio. We seek an uptrend, indicating outperformance and strong momentum.
Volatility Measures how much a security’s price fluctuates over time. High volatility means large price changes, indicating risk and potential reward.
Institutional Ownership Trend indicates whether the stock is under accumulation or distribution by the institutions.
EPS (Earnings Per Share): A financial metric calculated by dividing a company’s net profit by the number of its outstanding shares. It indicates the amount of profit attributed to each share of stock, serving as a key indicator of a company’s profitability.


