You can’t control the price action but you can do this… Read on and find out what it is. While it’s impossible to predict every market fluctuation, you can significantly enhance your trading outcomes by implementing a simple daily monitoring routine. This strategy helps you lock in profits and minimize losses with timely decisions.
The Power of Daily Monitoring
Every morning, I spend a few minutes checking the performance of my stocks. This small habit helps me catch negative trends before they spiral out of control. And isn’t that better than reviewing endless charts at the end of the week when it might be too late?
When to Consider Selling
So, what happens when I see a stock dipping for the second day in a row? This is my signal to consider selling. Why let a small loss turn into a disaster? Up next, I’ll explain what I do when the situation goes from bad to worse.
Deciding to Cut Losses
And on the third consecutive down day? That’s when I cut my losses. I sell the stock, no questions asked. It’s a tough rule, but one that has saved me more times than I care to count. What’s the rationale behind this strategy? I’ll delve into that now.
Case Studies: The Rule in Action
I’ve seen this two-day and three-day rule work wonders. For instance, last month, I avoided a significant loss on a tech stock by adhering to these rules. Here’s what I gained from that experience:
- I locked in a small profit before the stock plummeted further.
- I prevented a potentially bigger loss by acting swiftly.
details at a glance
Explanations for the Drawing
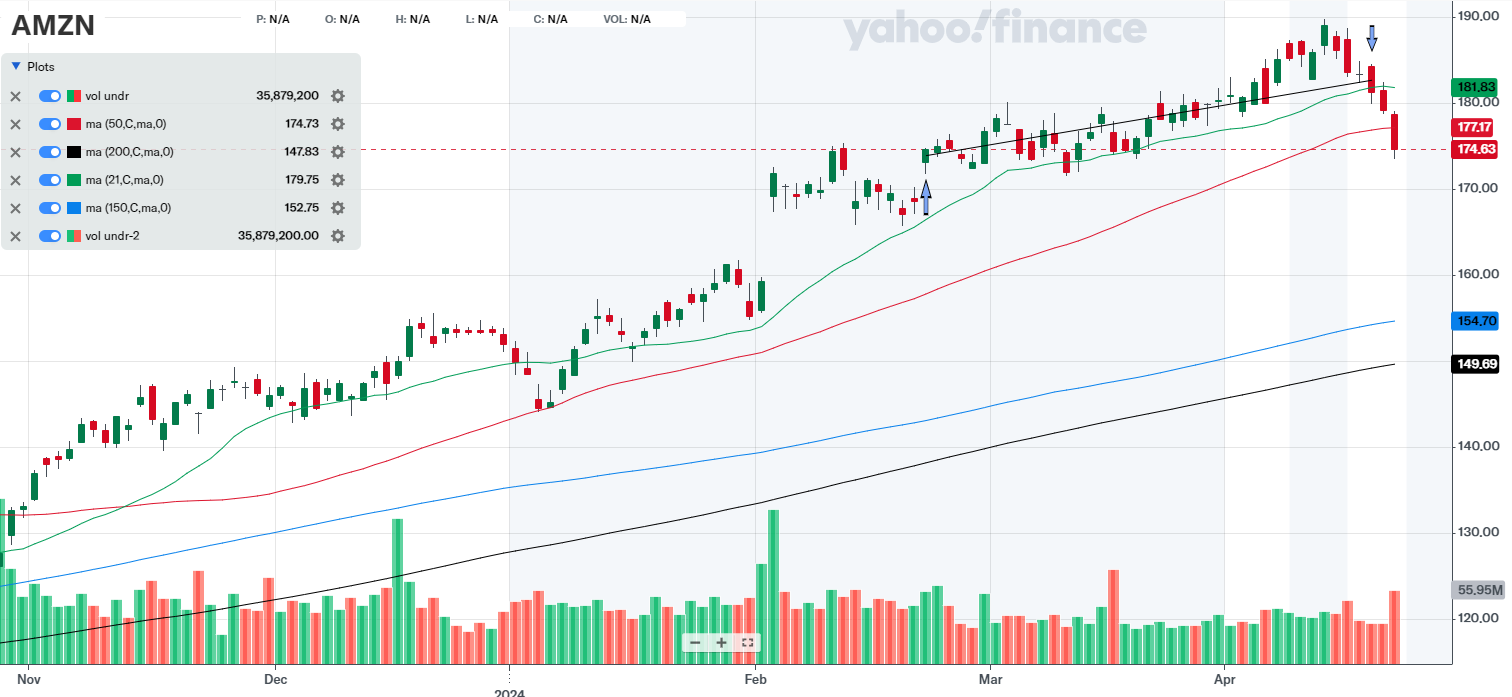
The upward purple arrow shows where I bought the stock. The downward purple arrow shows where I sold it.
Green Line 21-day exponential moving average line (see EMA 21 below)
Red Line 50-day simple moving average line (see SMA 50 below)
Black LIne 200-day simple moving average line (see SMA 200 below)

Opening Details
- Underlying: AMZN
- Date of Opening: 22 Feb 2024
- Underlying Price at Opening: $172.06
- Stop Loss: $164.96
- Profit Target: $206.47
- Market Outlook at Opening: Confirmed uptrend
- RS Rating: 93
- RS Line Trend: Up (U)
- Industry Rank (X / 197): 29
- Volume U/D Ratio: 1.2
- Institutional Ownership Trend: Up (U)
- Position Risk, %: 4.10
- Position Risk to NL, %: 0.33
- Potential Profit (position), %: 19.88
- Risk to Reward Ratio: 0.21
- Position Size, %: 8.08
- Reason for Opening Trade: Strong stock in a solid uptrend, close to EMA 21.
- Was it an Ideal Buy?: No. Price was not coming out of the base.
- Remarks at Opening:
- Stop-loss placed below recent low.
- If the stock starts to close the gap, plan to exit.
- With previous stocks advancing, portfolio value increased, allowing new positions.
Closing Details
- Date of Closing: 17 Apr 2024
- Closing Price: $181.91
- Market Outlook at Closing: Uptrend under pressure
- RS Rating at Closing: 93
- RS Change: 0
- Remarks at Closing: Position was stopped out after the stock declined for four consecutive days.
Results
- What Went Well?:
- Raised stop-loss, which locked in a small profit.
- Cause of Error / Improvement Needed:
- Need to focus more on stocks breaking out of their base.
- Initial purchase was when the stock was extended; it had risen more than two-fold since the lowest price of the first stage base.
- Position ROI, %: 4.54
- Position ROI (Portfolio), %: 0.37
- Position Open Time (Trading Days): 39
- Position Open Time (Days): 55
terms and definitions

EMA 21 Calculates the 21-period exponential moving average, highlighting short-term trends.
SMA 50 Averages the price over 50 periods, showing medium-term trends without overemphasizing recent data.
SMA 200 Averages the price over 200 periods, revealing long-term trends by treating all data equally.
Industry Rank Investor’s Business Daily’s system that ranks industries 1 to 197 based on performance. It guides us in CAN SLIM TRADING towards leading sectors.
U/D Ratio Measures stocks closing up versus down. A ratio above 1.0 indicates bullish sentiment, important in CAN SLIM TRADING.
RS Rating Ranks a stock’s performance on a 1 to 99 scale. I look for at least 85, showing strong momentum and growth potential.
RS Line Compares stock price to the market, plotted as a ratio. We seek an uptrend, indicating outperformance and strong momentum.
Volatility Measures how much a security’s price fluctuates over time. High volatility means large price changes, indicating risk and potential reward.
Institutional Ownership Trend indicates whether the stock is under accumulation or distribution by the institutions.
EPS (Earnings Per Share): A financial metric calculated by dividing a company’s net profit by the number of its outstanding shares. It indicates the amount of profit attributed to each share of stock, serving as a key indicator of a company’s profitability.
Overhead Supply: is a stock market term for a large amount of unsold shares at a certain price level, acting as resistance that prevents the price from rising. It occurs when investors looking to sell at break-even points add to the supply, making it hard for the stock to increase in value until this excess is bought up.


