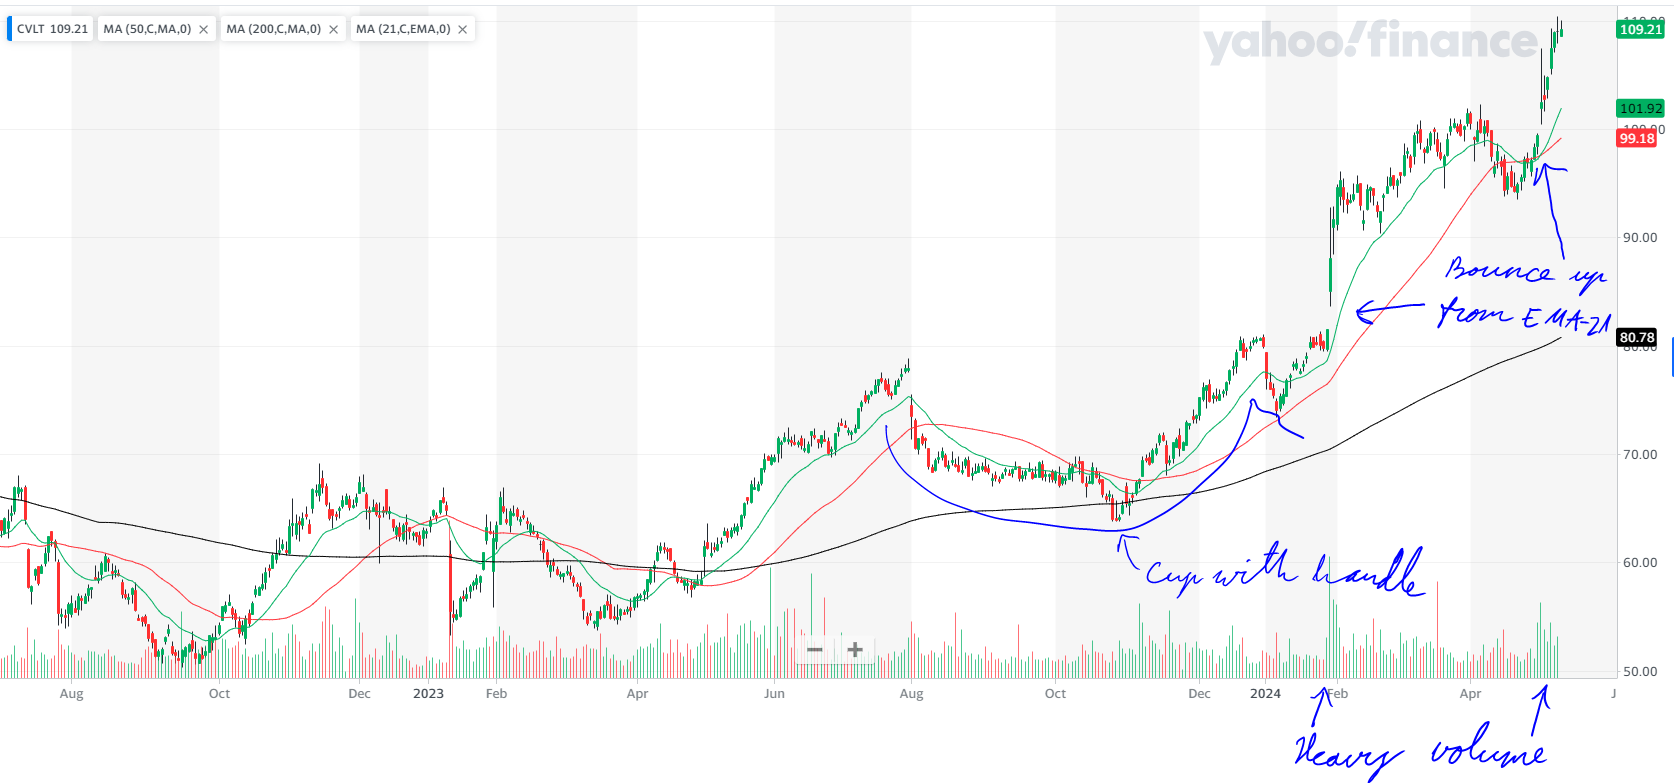
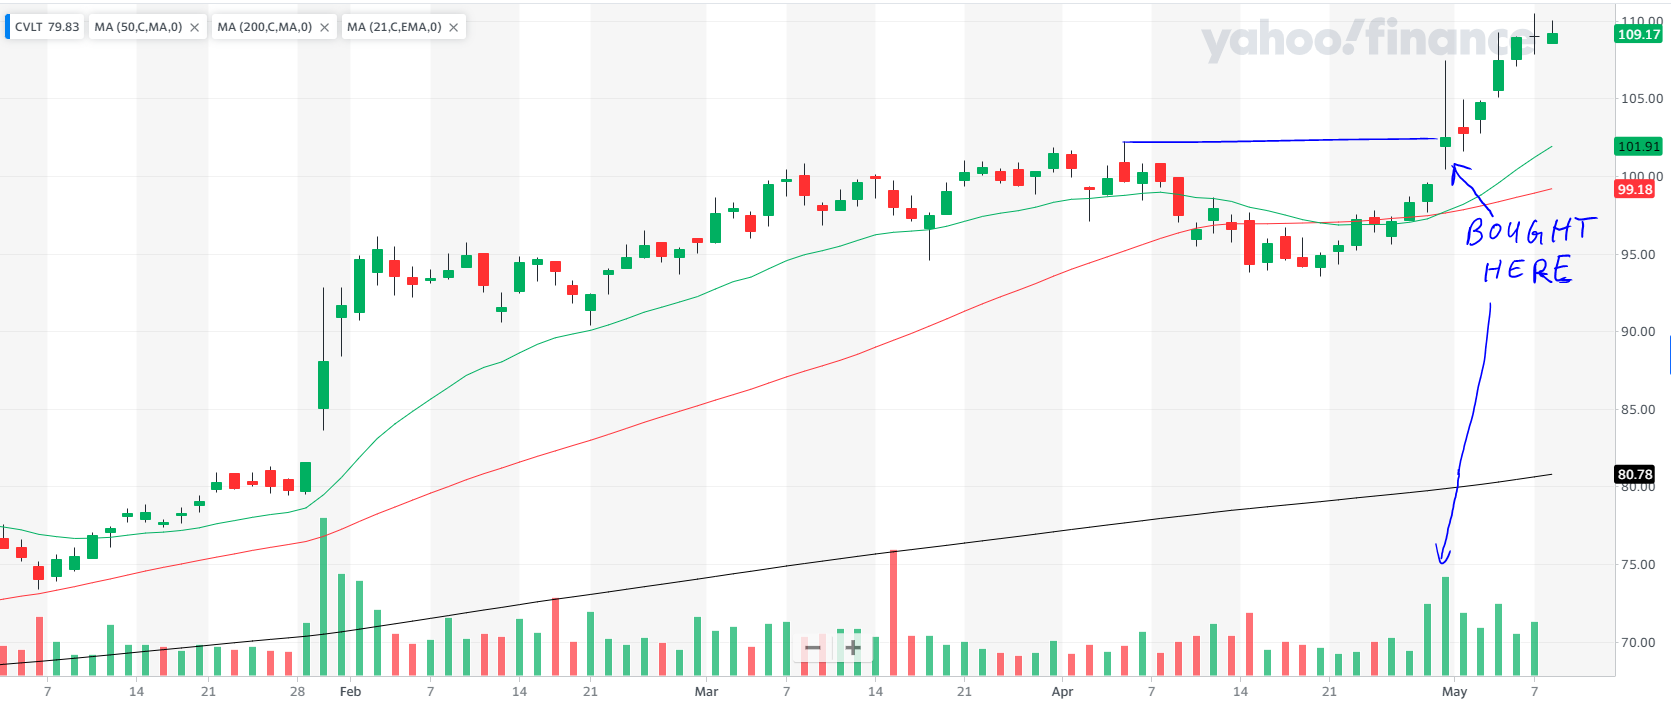
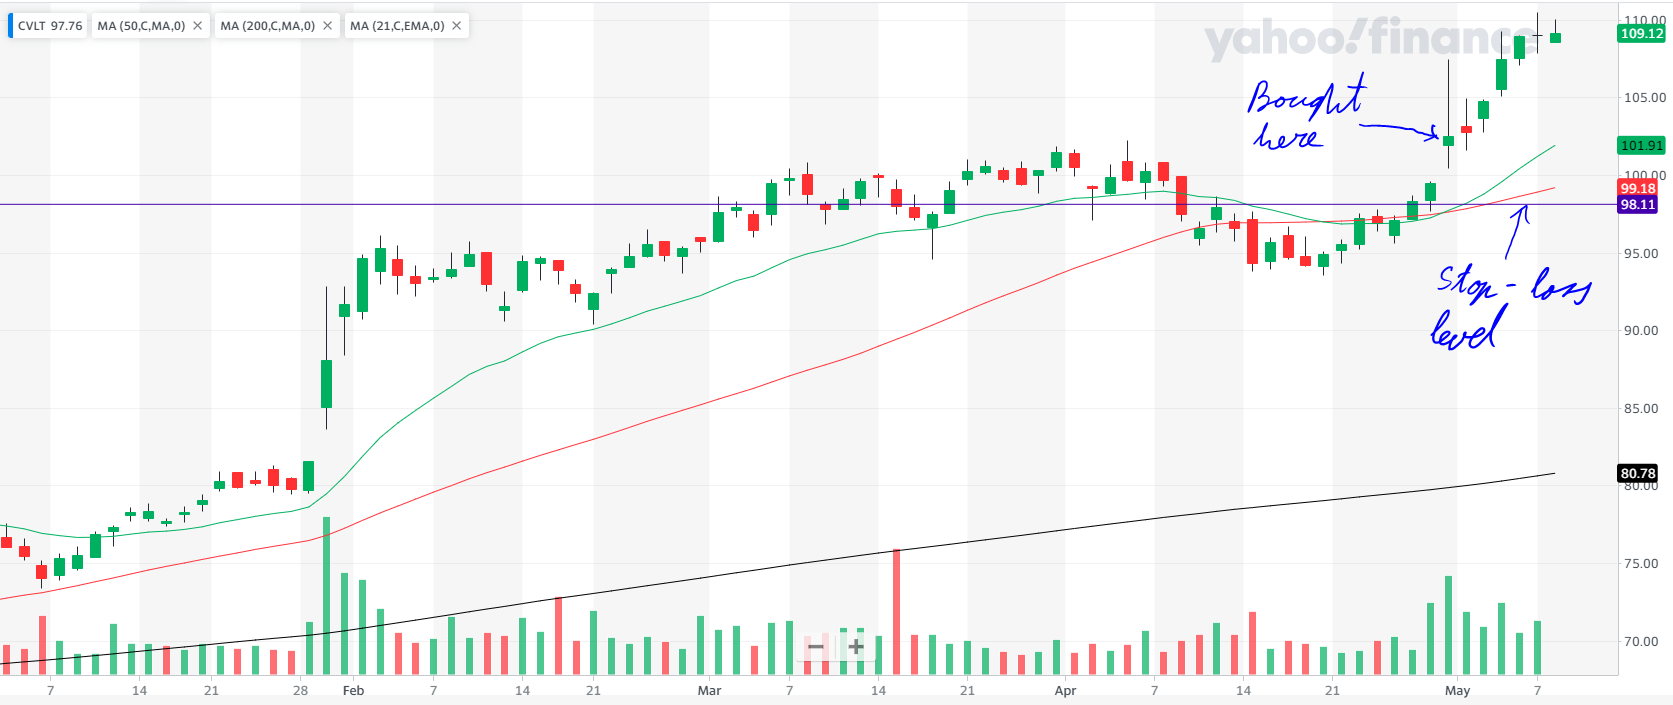
This article provides a detailed analysis of how I purchased CVLT stock in just 5 minutes and the position became immediately profitable. You can copy the strategy and use it in your own investing. Doing this saves you a lot of time and money.
GENERAL STOCK REQUIREMENTS

Choosing the right stocks isn’t a game of chance; it’s a deliberate strategy. This time, with a plethora of options at my fingertips, I could afford to be pickier. So, what were the non-negotiables?
First off, industry leadership was paramount. I zeroed in on stocks from the top echelons—specifically, the TOP 10 out of 197 industries. Why? Because these represent the crème de la crème, the TOP 5% leading the charge. It’s not just about being good; it’s about being outstanding.
Next, the foundation matters. I looked for stocks with base depths signaling strength without overextension—ideally, between 10-20%, stretching up to 35% for those in a cup pattern. It’s a balance between stability and potential, ensuring our picks have solid ground beneath them.
Moreover, the up/down ratio needed to be above 1.0, a clear indicator of upward momentum. Similarly, the trend in institutional ownership couldn’t just be stable; it had to be climbing. These are the signs that savvy investors are not just watching but actively betting on these stocks.
The RS line and rating were the final seals of approval. An uptrend in the RS line and a rating of at least 85 out of 100 ensures we’re backing winners, not just participants.
By setting these stringent criteria, we’re not casting a wide net; we’re spearfishing for the best. In a sea of choices, we’re not looking for just any fish; we’re after the prize catches that promise not just to survive but to thrive.
TERMS AND DEFINITIONS

EMA 21 Calculates the 21-period exponential moving average, highlighting short-term trends.
SMA 50 Averages the price over 50 periods, showing medium-term trends without overemphasizing recent data.
SMA 200 Averages the price over 200 periods, revealing long-term trends by treating all data equally.
Industry Rank Investor’s Business Daily’s system that ranks industries 1 to 197 based on performance. It guides us in CAN SLIM TRADING towards leading sectors.
U/D Ratio Measures stocks closing up versus down. A ratio above 1.0 indicates bullish sentiment, important in CAN SLIM TRADING.
RS Rating Ranks a stock’s performance on a 1 to 99 scale. I look for at least 85, showing strong momentum and growth potential.
RS Line Compares stock price to the market, plotted as a ratio. We seek an uptrend, indicating outperformance and strong momentum.
Volatility Measures how much a security’s price fluctuates over time. High volatility means large price changes, indicating risk and potential reward.
Institutional Ownership Trend indicates whether the stock is under accumulation or distribution by the institutions.
EPS (Earnings Per Share): A financial metric calculated by dividing a company’s net profit by the number of its outstanding shares. It indicates the amount of profit attributed to each share of stock, serving as a key indicator of a company’s profitability.
STAGES OF THE BASES
STAGE 1: BASING OR BOTTOMING STAGE
Definition: A period following a stock’s decline where it starts moving sideways, forming a base. This stage signifies the easing of downward pressure and the beginning of stabilization, indicating that the stock is not in an uptrend yet but is preparing for potential future growth.
STAGE 2: ADVANCING OR UPTREND STAGE
Definition: The phase in which a stock breaks out of its base on significant volume, indicating a strong buying interest and the initiation of a new uptrend. This stage is considered the most opportune time for investors to purchase the stock, as it is expected to achieve substantial gains.
STAGE 3: TOP OR PEAKING STAGE
Definition: A stage characterized by the stock beginning to exhibit signs of losing momentum after its upward movement. The stock may start to move sideways with increased volatility compared to Stage 1. This suggests the stock might be reaching its peak, and the existing uptrend could be weakening.
STAGE 4: DECLINING OR DOWNTREND STAGE
Definition: This final stage occurs when the stock breaks down from its Stage 3 pattern and enters into a downtrend, marked by a sequence of lower lows and lower highs. It signifies that selling pressure has surpassed buying interest, usually serving as a signal for investors to sell the stock to mitigate further losses.
Wrapping It Up

Can you really make a game-changing investment decision in five minutes? Absolutely—with the right data and a solid plan, swift decisions can yield great results. And remember, it’s not just about quick wins; it’s about smart management.
Interested in seeing the charts and diving deeper into my strategy? Keep reading, and don’t hesitate to reach out here if you want to discuss strategies or have any questions. Remember, in the world of investing, time is money—don’t waste either!


