Think It’s Too Late to Buy? Think Again! Let’s dive straight into a strategy that might seem counterintuitive: buying stocks at higher prices. Why consider this approach? It minimizes guesswork and boosts confidence in your investment choices. This article unpacks a simple rule that helps you make smarter decisions, reduce risks, and stabilize your portfolio. Excited to see how this can change your investing game? Keep reading as we explore the benefits of buying high.
Understanding the Purchase Decision
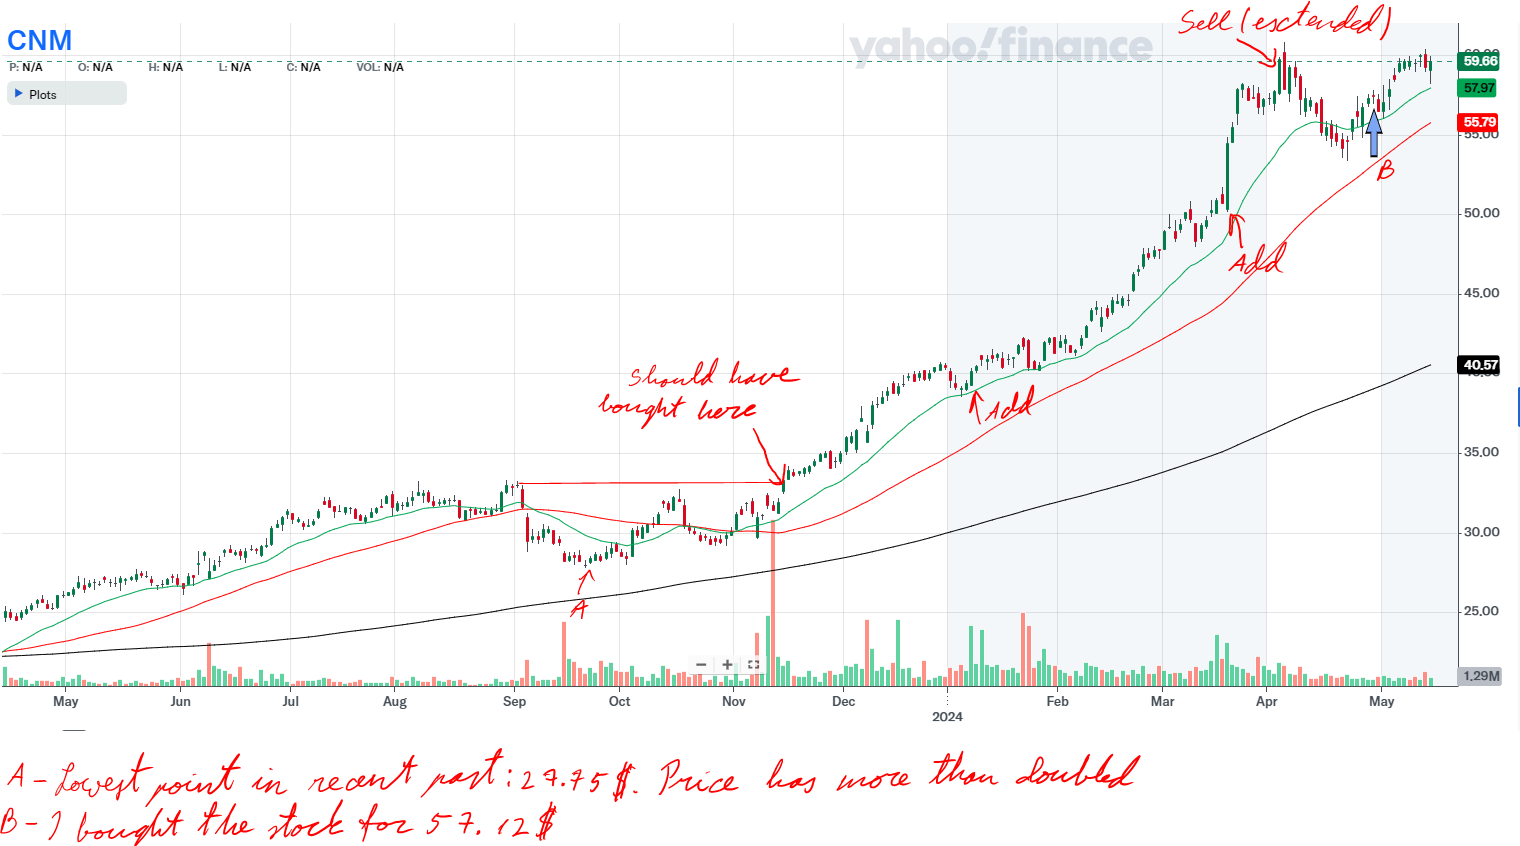
Last April 29, I snagged shares of Core & Main Inc. (CNM) at $57.12 each. Sure, that price was hot on the heels of a dramatic climb from its September low of $27.45. Why buy after such a spike?
And here’s where it gets interesting. Typically, I shy away from stocks that have doubled their last low. But there’s a twist to every rule, isn’t there? I buy high because buying low is like trying to catch a falling knife—you never know how low it can really go. Will it drop further? Only time will tell, but I prefer to enter when the stock shows signs of recovery.
Risk Management Tactics
Buying at a higher price seems risky, right? It’s actually the opposite. To manage risks smartly:
- I took a small position, only 5% of my portfolio.
- I set a tight stop-loss at 3%.
So, what’s the real risk to my portfolio with these numbers? Just 0.16%. It’s all about keeping the losses small—like making sure a paper cut doesn’t turn into a severed limb.
Portfolio Strategy and Position Sizing
I start small. Always. It’s like dipping your toes in the water before diving in. This approach allows me to adjust my strategy as the stock’s performance unfolds. What happens if the stock proves its worth? I start adding more shares.
And of course, each addition comes with its own set of new stop-losses. Ever seen a cowboy without a lasso? That’s not me—I never ride a stock without a stop-loss.
Market Trends and Indicators
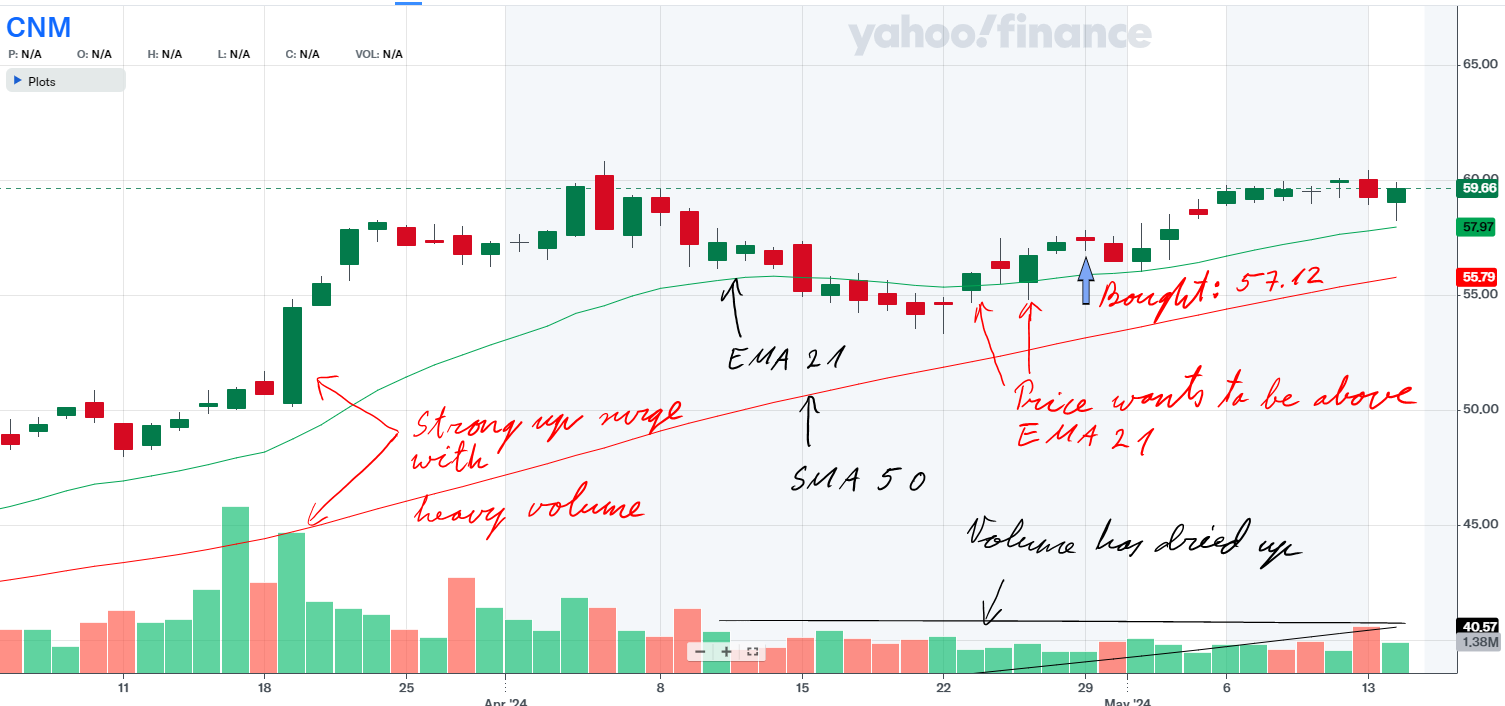
The trend is your friend—until it isn’t. When I bought CNM, the upward volume was more robust than the downward. More buyers than sellers, a good sign. And institutions piling in? Even better. But we’re always on guard. The trend is mature; could the winds shift soon? Stay tuned, and we’ll keep an eye on that together.
Details at a Glance
Explanations for the Drawings: The upward purple arrow shows where I bought the stock. The downward purple arrow shows where I sold it.
Green Line 21-day exponential moving average line (see EMA 21 below)
Red Line 50-day simple moving average line (see SMA 50 below)
Black Line 200-day simple moving average line (see SMA 200 below)

I bought the stock at the point B on the right side of the chart. See how much the price had appreciated before I took the position!
The ideal buying point would have been in November 2023 (pointed out on the stock chart). At that point the stock broke out of the base and started trending up.
If you had bought there you could have added to the existing position when the stock bounced up from the EMA 21.

The main reason I bought is that the stock had a strong up surge with heavy volume lately at the same price level. Also, it had bounced up again from the EMA 21 line.
summary
- Stock: Core & Main Inc. (CNM)
- When I Bought: April 29, 2024
- Price Per Share: $57.12
- My Portfolio Exposure: 5%
- Stop-Loss: 3%
- Risk to My Portfolio: 0.16%
Terms and Definitions

- Extended Stock: When a stock’s price is high relative to its recent lows.
- EMA 21 Calculates the 21-period exponential moving average, highlighting short-term trends.
- SMA 50 Averages the price over 50 periods, showing medium-term trends without overemphasizing recent data.
- SMA 200 Averages the price over 200 periods, revealing long-term trends by treating all data equally.
- Pivot price is the optimal buy point of a stock is defined as the moment it transitions from a stable basing area or chart pattern and begins to achieve new highs in price.
- Industry Rank Investor’s Business Daily’s system ranks industries 1 to 197 based on performance. It guides us in CAN SLIM TRADING towards leading sectors.
- U/D Ratio Measures stocks closing up versus down. A ratio above 1.0 indicates bullish sentiment, important in CAN SLIM TRADING.
- RS Rating Ranks a stock’s performance on a 1 to 99 scale. I look for at least 85, showing strong momentum and growth potential.
- RS Line Compares stock price to the market, plotted as a ratio. We seek an uptrend, indicating outperformance and strong momentum.
- Volatility Measures how much a security’s price fluctuates over time. High volatility means large price changes, indicating risk and potential reward.
- Institutional Ownership Trend indicates whether the stock is under accumulation or distribution by the institutions.
- EPS (Earnings Per Share): A financial metric calculated by dividing a company’s net profit by the number of its outstanding shares. It indicates the amount of profit attributed to each share of stock, serving as a key indicator of a company’s profitability.
- Overhead Supply: is a stock market term for a large amount of unsold shares at a certain price level, acting as resistance that prevents the price from rising. It occurs when investors looking to sell at break-even points add to the supply, making it hard for the stock to increase in value until this excess is bought up.
Conclusion
Diving into high-priced stocks like CNM might seem like surfing during a hurricane, but with the right strategies, it’s more like navigating a brisk breeze. By controlling risk with precise stop-losses and sizing positions wisely, I stay ready for whatever the market throws my way. Isn’t that what smart investing is all about—playing it safe while playing to win? And remember, it’s not just about making money; it’s about not losing it catastrophically. So, strap in, keep your eyes on the horizon, and let’s ride this market with a cool head and a sharp eye. Who says you can’t teach an old dog new tricks?
By the way, if you have any questions, give me a note here and I’ll get back to you.


