What are the ins and outs of getting the 1/7 risk-to-reward ratio? Dig in and find out how to set up a perfect trade.How I made 18.13% in 30 days while risking just 2.5%
If you time your actions properly it is possible to get spectacular returns from the market while risking just a dime. Does it always happen? Not so. But if you keep your eyes open and try to get better every day, this happens more often than you can imagine.
The story of my second part of the VECO trade.
How I made 18.13% in 30 days while risking just 2.5%
trade setup
Here’s the big picture of the VECO stock price:
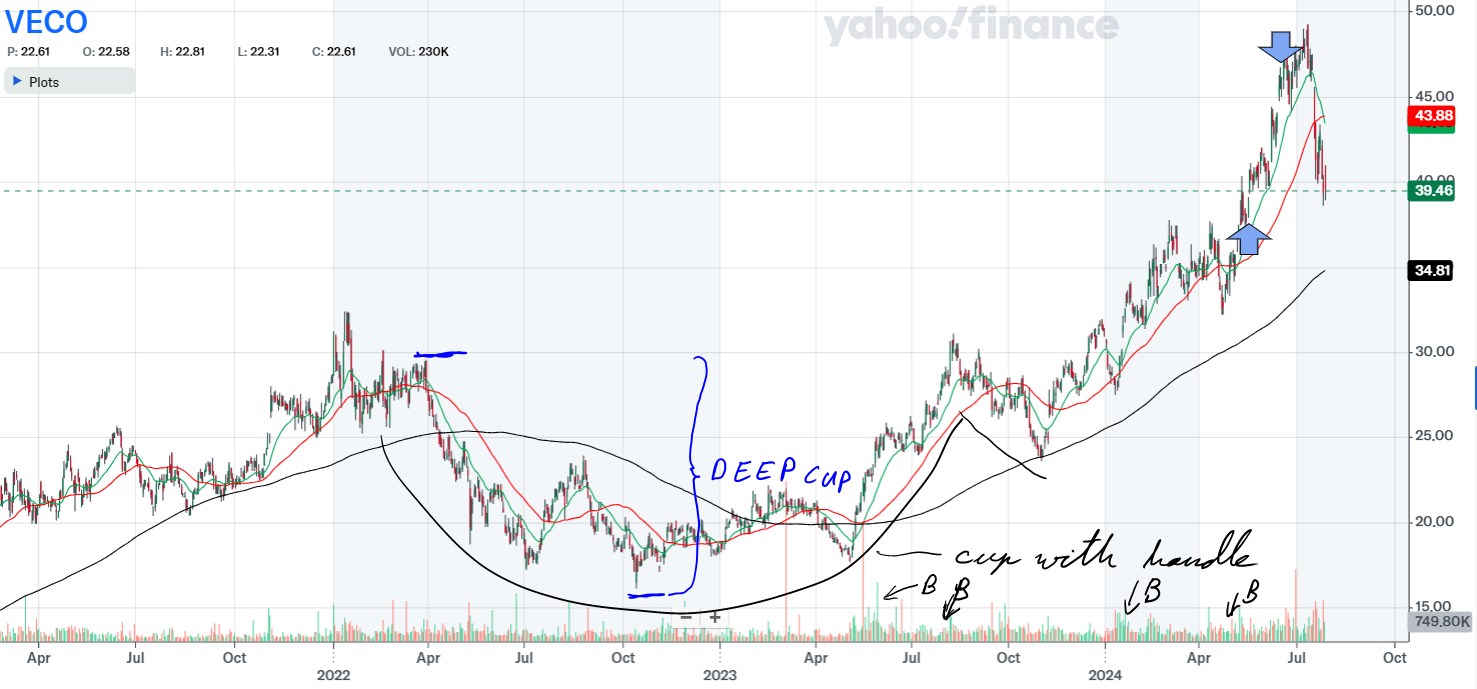
As you can see, the price drew a quite deep cup with handle price pattern back in 2022 to 2023. This usually wouldn’t be the best setup but if you pay attention to the volume at the bottom of the cup area you can see that it has dried up. What does it mean?
This means that the selling pressure was gone. Once that happened, a buying pressure started to come in:
See the small arrows with the letter ‘B’ in the volume chart.
After that, the stock started trending up.
How I made 18.13% in 30 days while risking just 2.5%
my trade
As you’ve probably guessed, the time I was in the trade is between these blue arrows:
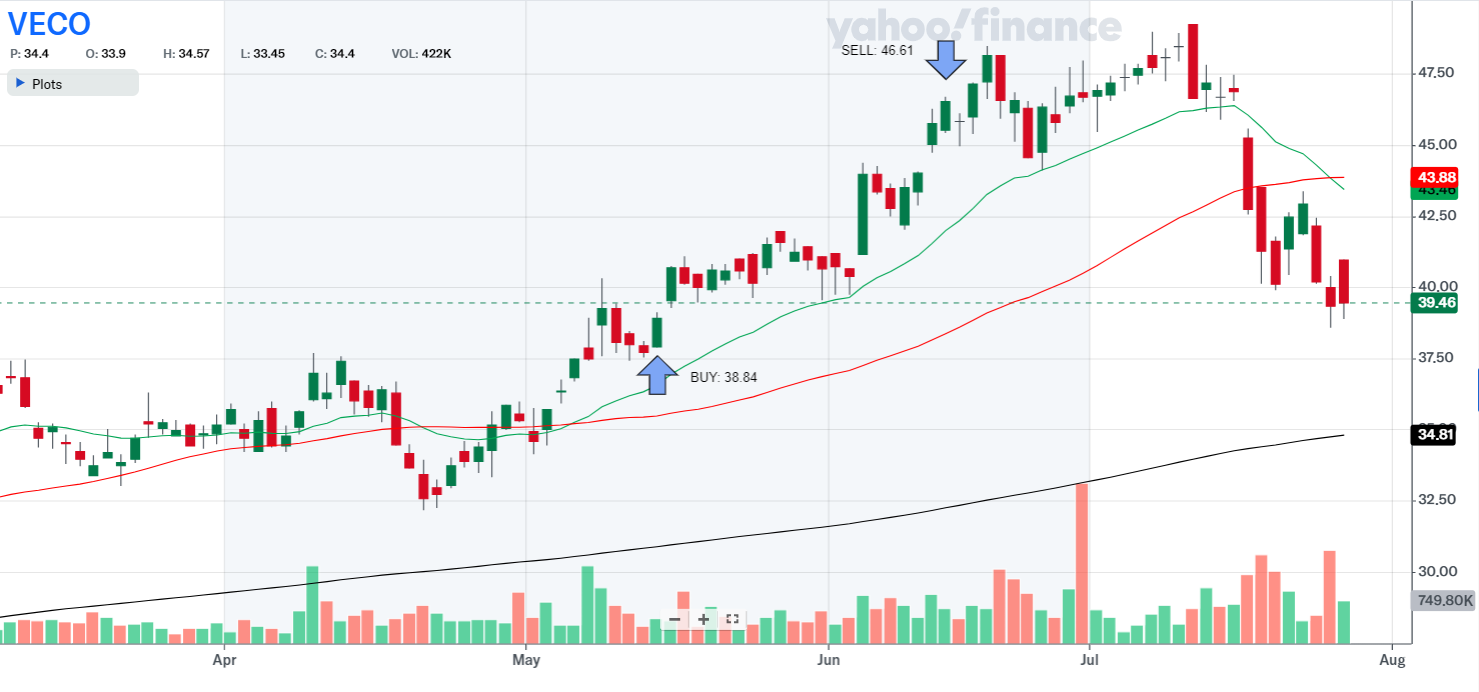
Compare these two pictures above and see how late I bought the stock! Wouldn’t it be better to buy at the bottom of the base?
I have lost a lot of profit potential trading like this – why is that reasonable?
How I made 18.13% in 30 days while risking just 2.5%
buying from the bottom
Do you know what is the main disadvantage of buying from the bottom?
It’s that you don’t know where the bottom is! And you will never know. This would be like catching a falling knife.
As controversial as it may sound, buying from the top is much safer. Of course, some nuances and conditions must be considered (e.g. price volatility, the stop-loss, profit target, etc).
When buying from the top, the price already has its upward momentum and it will likely continue to go up. This is the reason I’m buying high and I would suggest everybody else do the same.
How I made 18.13% in 30 days while risking just 2.5%
buy point
Let’s zoom in on the buying point for a second:
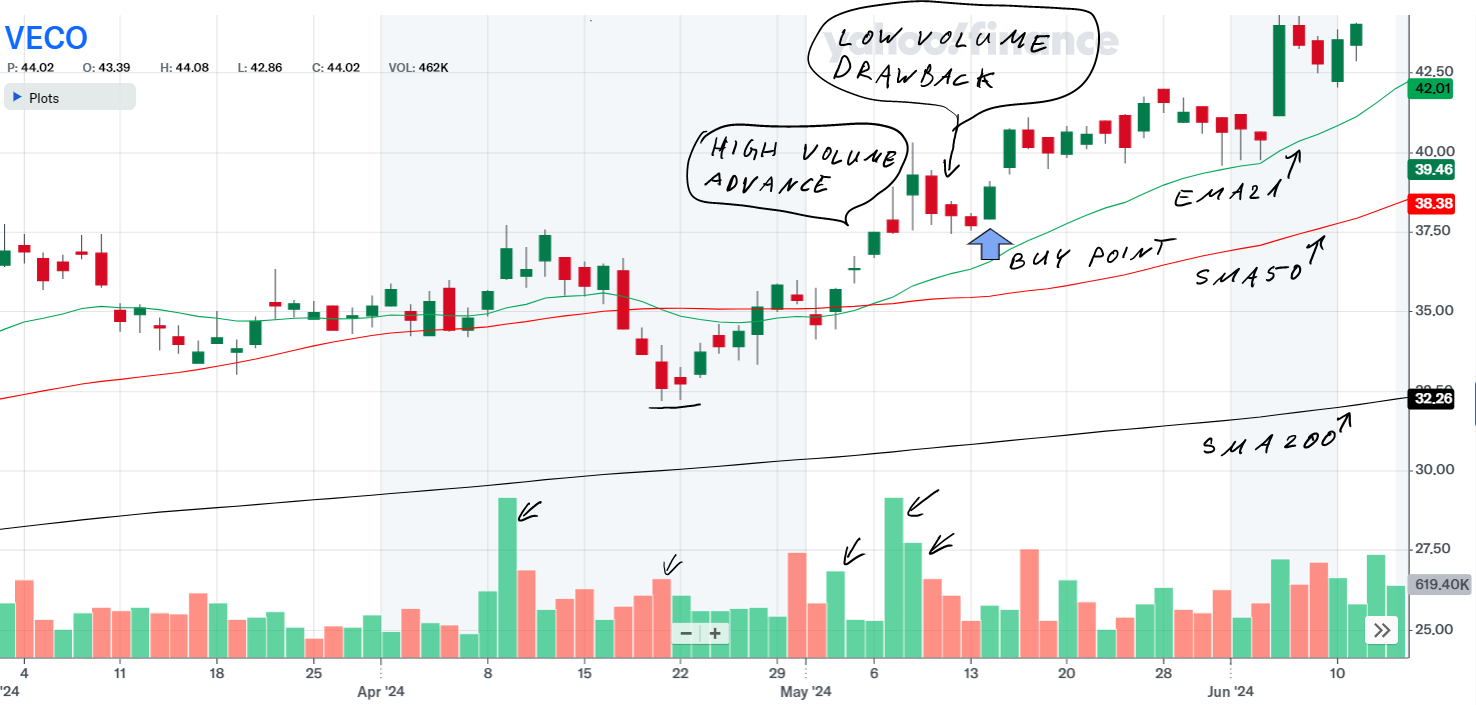
As always, the blue arrow in the drawing represents the buying point. Why did I buy at that time?
1. price was above key moving averages
As you can see, the main key moving averages (EMA 21, SMA 50 and SMA 200) were below the price at that time. This is a strong indication for an uptrend.
Also, it’s worth noting that the stock price was just SLIGHTLY above the highest key moving average. This means that it wasn’t extended. Extended stocks tend to give back some of their profit.
2. buying pressure
Another indication for the continuing uptrend was the fact that, before buying, the stock had appreciated with high volume and the drawbacks were with low volume.
See the green high bars while the price was rising and the lower red bars when the price was declining.
I must say that I’m quite confused as to why the 50-day volume up/down ratio was just 1.0.
How I made 18.13% in 30 days while risking just 2.5%
what happened next?
I bought the stock on the 14th of May for 38.84.
The stop-loss?
The stop-loss was placed at 37.86 <— VERY TIGHT! Why?
Because this was an addition to the first price. I added to the previous position because the initial position was up more than 2%. You can delve into the initial position here.
When I add to the position, I don’t want to risk much because usually the buying points are not ideal and there will be some additional risks.
after buying…
There was just a smooth ride:
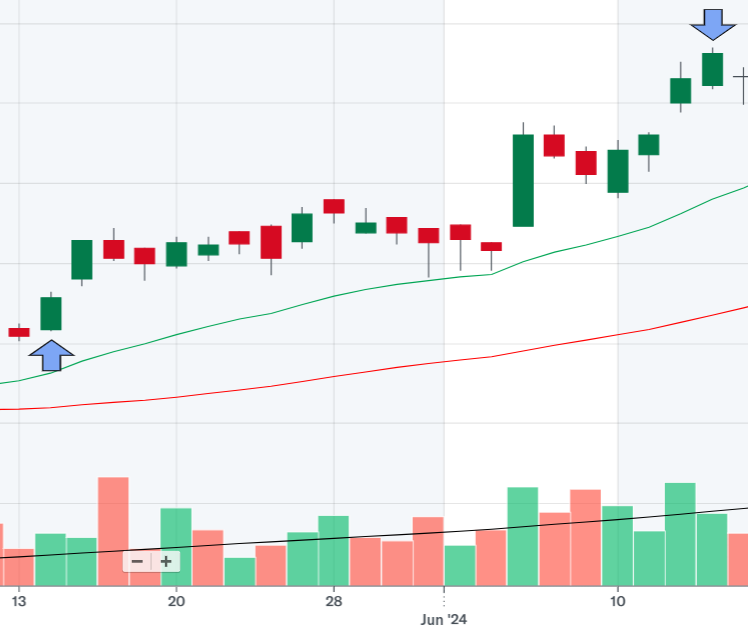
But wait! Why did I sell there? The price was continuing to go up!
Above all, we must honor our trading rules!
I had set the profit target to the price level of $46.61 and the price reached it. Although, it’s psychologically hard I had to realize the profit and eliminate the position.
sell into strength!
Also, the book says you must sell when the price rises.
As I have noted later, this can happen if you don’t sell into strength:
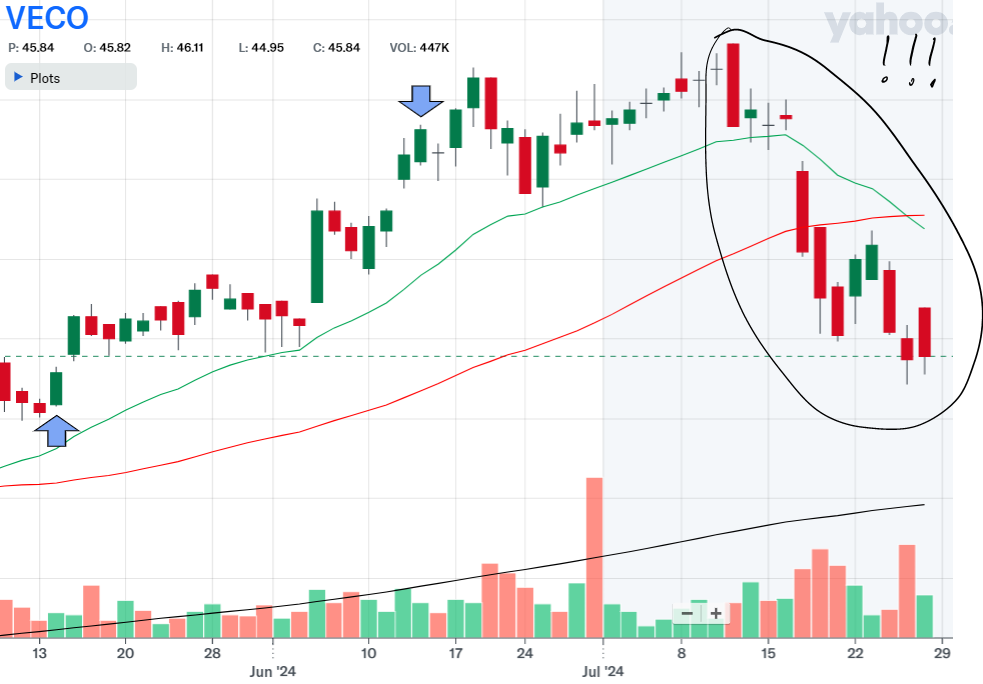
You don’t want to give back all of your hard-earned profits, do you?
All in all, this is a perfect example of why we should never get ‘married’ with any of our positions or stocks in the market.
Above all, the price action is the only thing that matters.
As a result, I sold the position at $46.61 and realized a profit of 18.13% for 30 days.
How I made 18.13% in 30 days while risking just 2.5%
an ideal trade?
Although this was almost an ideal trade, there is always room for improvement. As long as we are forcing ourselves to eliminate mistakes one at a time, our results will improve.
a word about opening
Basically, the opening point was almost ideal but it couldn’t be 100% ideal because the position itself was an addition.
Consequently, the opening price was slightly high.
trade management
As I have noted I sold once the profit target was reached. Given the fact that the position was bought close to its buying point and sold right there where it was planned, I would consider the overall management as ideal.
improvements needed
profit target
While the trade was on, I discovered that the profit target was set to just 20% above the buying point. The book says it can be somewhere between 20-25%.
If you set the target to 20% your profit will be less than that because you are also paying commissions for your trade. Therefore, the mark should be higher.
Why didn’t I set the target higher during the trade?
One of my rules is that I DON’T CHANGE THE RULES DURING THE TRADE. Therefore, this was not an option.
portfolio profit
This trade resulted me a portfolio profit of 0.97%. This is small. While being happy about the trade, the overall portfolio impact should be much better.
On the whole, this is the biggest challenge for me right now – HOW TO INCREASE THE OVERALL PROFIT FOR THE PORTFOLIO while keeping the risks under control?
solution?
Hard work, trial and error. This is the best I can do right now.
In summary, it’s all about getting better.
How I made 18.13% in 30 days while risking just 2.5%
details at a glance
Explanations for the Drawing: The upward purple arrow shows where I bought the stock. The downward purple arrow shows where I sold it.
Green Line 21-day exponential moving average line (see EMA 21 below)
Red Line 50-day simple moving average line (see SMA 50 below)
Black Line 200-day simple moving average line (see SMA 200 below)

Opening
- Underlying: VECO
- Date: 14 May 2024
- Underlying Price: 38.84
- Stop Loss: 37.86
- Position risk, %: 2.50
- Position Risk to NL, %: 0.13
- Profit Target: 46.61
- Potential Profit (position), %: 19.83
- Risk to Reward Ratio: 0.13
- Market Outlook: Confirmed uptrend
- RS Rating: 89
- RS line trend (U/N/D): U
- Industry Rank (X / 197): 30
- Volume U/D Ratio: 1.0
- Institutional Ownership Trend (U/N/D): U
- Position size, %: 5.33
Closing
- Date: 13 Jun 2024
- Price (close): 46.61
- Market Outlook: Confirmed uptrend
- RS Rating: 97
- RS Change: 8
Results
- Position ROI, %: 18.13
- Position ROI (portfolio), %: 0.97
- Position Open Time (trading days): 22
- Position Open Time (days): 30
How I made 18.13% in 30 days while risking just 2.5%
terms and definitions

Ever felt like trading lingo was designed just to keep amateurs out of the loop? Consequently, let’s simplify a couple of terms:
How I made 18.13% in 30 days while risking just 2.5%
related to price
EMA 21 calculates the 21-period exponential moving average, thus highlighting short-term trends.
SMA 50 averages the price over 50 periods, thereby showing medium-term trends without overemphasizing recent data.
SMA 200 averages the price over 200 periods, thereby revealing long-term trends by treating all data equally.
Pivot price is the optimal buy point of a stock, specifically defined as the moment it transitions from a stable basing area or chart pattern and begins to achieve new highs in price.
RS Line compares stock price to the market, and it is plotted as a ratio. We seek an uptrend, thus indicating outperformance and strong momentum.
Volatility measures how much a security’s price fluctuates over time. High volatility, therefore, means large price changes, indicating risk and potential reward.
How I made 18.13% in 30 days while risking just 2.5%
ratios and ranks
Industry Rank, according to Investor’s Business Daily’s system, ranks industries 1 to 197 based on performance. It therefore guides us in CAN SLIM TRADING towards leading sectors.
U/D Ratio measures stocks closing up versus down. A ratio above 1.0, consequently, indicates bullish sentiment, which is important in CAN SLIM TRADING.
RS Rating ranks a stock’s performance on a 1 to 99 scale. I look for at least 85, consequently showing strong momentum and growth potential. This means that the stock outperforms at least 85% of the stocks in the market.
Institutional Ownership Trend indicates whether the stock is under accumulation or distribution by the institutions.
EPS (Earnings Per Share) is a financial metric calculated by dividing a company’s net profit by the number of its outstanding shares. It, therefore, indicates the amount of profit attributed to each share of stock, serving as a key indicator of a company’s profitability.
Overhead Supply is a stock market term for a large number of unsold shares at a certain price level, thereby acting as resistance that prevents the price from rising. It occurs when investors looking to sell at break-even points add to the supply, thereby making it hard for the stock to increase in value until this excess is bought up.
How I made 18.13% in 30 days while risking just 2.5%
conclusion
In summary, this was an example of close to an ideal trade. After all, it doesn’t matter if it was ideal or not. The point often overlooked is as I said earlier, to get better.
So, should we improve an ideal trade? Definitely. This is how we will be better tomorrow.

