Introduction
The APG stock trade ran from November 21, 2023, to January 3, 2024. It showcases strategic decisions in a dynamic market. We explore how technical indicators interact with market dynamics. This offers key insights for all traders. A strategic opening price and calculated stop-loss guide this journey. It ends with an analysis that reflects expert trading practices.
Trade details

Opening date: 2023-11-21
Opening price, $: 29.64
Stop-loss, $: 27.86
Position Risk, %: 5.93
Profit target, $: 35.59
Open RS: 94.0
Market Outlook: Confirmed uptrend
Closing date: 2024-01-03
Closing price, $: 31.09
Closing RS: 91.0
RS Change: -3
ROE pos, %: 2.61
ROE portfolio, %: 0.11
Days Open: 43
Why Did I Open?
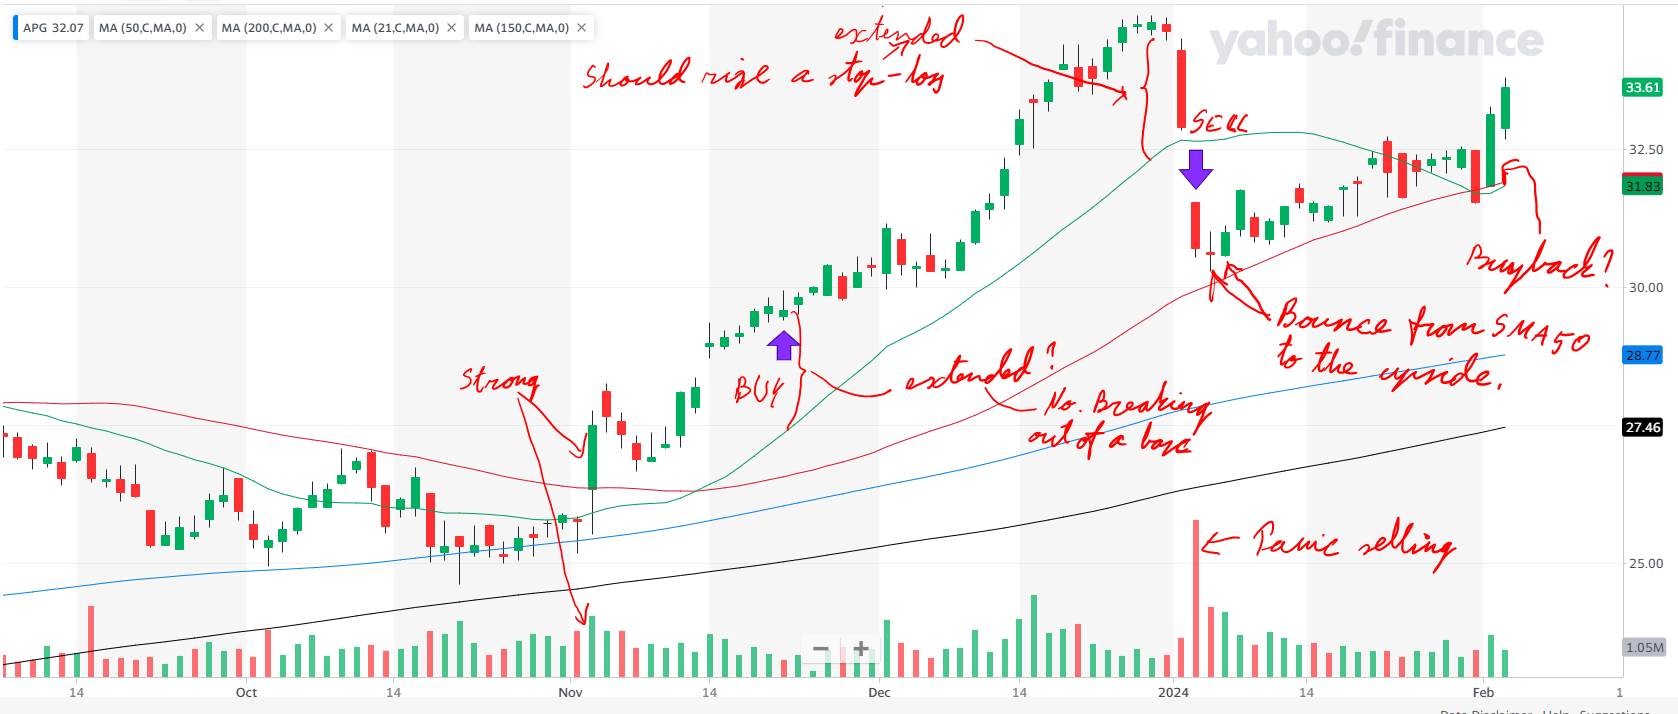
The trade opening hinged on two critical insights. First, the stock’s upbeat response to its earnings report hinted at solid financial health, often leading to a rise in stock price. Investors favor stocks that show strong earnings reactions, as they signal growth potential and strength. Second, traders identified the stock as being in the “buy zone,” a price range attractive for buying. Technical analysis, including support levels and moving averages, helps pinpoint this zone, suggesting the stock is set for an upward trend. Being in the buy zone means the stock was at an ideal entry point, offering a great chance to invest with a positive growth outlook.
Opening Remarks
We cautiously entered the position, wary of the trading volume. The trade’s start didn’t match our criteria due to low volume. Low volume at breakout can signal weak moves. The entry price was high, near the buy zone’s top, about 5% above the pivot. The pivot is crucial for spotting market trends and reversals. Entering above the pivot raises the trade’s risk, hinting at less safety and profit potential if the stock drops.
Why Did I Close?
A sharp price drop led us to close the position. Rapid declines may hint at deeper issues or changing sentiment. I reassessed the stock’s place in our portfolio. Also, the RS rating fell by 3 points, affecting our decision. The RS rating compares a stock’s performance to the market. A dropping RS suggests losing momentum, signaling weakness. This price drop and RS decline drove us to exit and protect our investment.
What Went Well?
Trading decisions are well-timed, and based on solid technical analysis. Purchase made after observing strong price action, and substantial volume. Strong buyer interest, and potential for upward momentum, traders seek. Selling executed with precision, stock breached 21-day EMA. EMA 21 assesses short-term trends, and proactive measures, and prevents losses. Disciplined approach to risk management, selecting steady, tight price action. Lower volatility, predictable movements, clear entry, exit points, strategic trading.
What Needs to be Improved?
Areas for improvement identified upon reflecting on the trade. Stop-loss should have been adjusted upward as stock price extended. Safeguard gains, set new floor price at higher levels, secure profits.
Maintaining closer watch on the stock necessary post-exit. Stock’s price increased again, suggesting premature exit. Keep stock on radar, reassess, re-enter under favorable conditions. Ongoing monitoring, willingness to re-evaluate crucial for success.
Lessons Learned
Experience reaffirms market conditions impact stock trading outcomes significantly. Solid individual stock strategy can be affected by broader market movements.
This trade fell short of the profit target, breaking even. Case study in realistic expectations and the importance of market context. Although not as profitable as expected, it resulted in a slight gain. Highlights the value of minor gains and the significance of risk management. Securing a small profit is preferable to incurring a loss. Adaptability and vigilant risk assessment are crucial for success.
Market Conditions During the Trade
Market conditions during the trade were notably positive. S&P 500 and NASDAQ showed a solid uptrend. Bullish sentiment marked by sustained stock price increase and optimism. Major indices rising can boost individual stock and sector performance. Creates a favorable trading environment.
S&P 500 and NASDAQ traded above key moving averages. Moving averages smooth price data, aiding trend identification. Above-average indexes indicate strong current market conditions. Healthy investor support in the market.
Indices above moving averages suggest underlying market strengths. Encourages long-side trading and potential success. Important to note that not all trades are profitable in positive markets. Individual stock analysis remains crucial even in such conditions.
key takeaways from apg stock trade analysis
- Strategic Entry and Exit Points: Choosing the right moments is critical. Entry after a strong earnings report is disciplined. Exiting below EMA 21 reflects technical analysis-guided strategy.
- Influence of Market Trends: Market conditions significantly impact stock performance. Consideration of indexes like S&P 500 and NASDAQ is vital. Central to trade planning is understanding market trends.
- Risk Management and Adaptability: Ongoing risk management and adaptability are crucial. Adjusting stop-loss strategies is essential. Vigilance for potential re-entry points optimizes outcomes.
Conclusion of APG Stock Trade Review
The APG stock trade in late 2023 to early 2024 offers insights. Strategic entries and exits demonstrate disciplined trading. Market trends influenced stock performance. Market forces can be allies but require careful navigation.
The trade emphasizes risk management and adaptability. Adaptability is crucial amid market volatility. Key takeaways champion planning and active trade management. Flexibility is vital in ever-changing market landscapes.


