introduction
Navigating the stock market is akin to deciphering an ancient script where every symbol, every line, carries a depth of meaning. A mere glance at a stock chart might make you feel like a seasoned seer, but without deeper analysis, it’s like reading a book by its cover and expecting to know the story inside (I am a victim of that as well). Let’s explore the art of reading stock charts beyond the surface glance and delve into the strategies that can turn you from a casual observer into a market maestro.
The Deceptive Simplicity of Recent Lows
The Warning Signals
Recent lows on a stock chart are not just numbers; they’re the market’s way of whispering secrets about investor sentiment and potential reversals. Ignoring these can be likened to ignoring smoke signals from a distant fire, hoping it won’t reach your camp. These lows are critical in setting stop-loss points—safety nets that protect you from falling too hard when the market takes an unexpected turn.
Setting the Safety Net
The art of setting a stop-loss based on recent lows is like anchoring your ship away from the storm. It’s about finding that sweet spot where you’re protected from sudden squalls without being so cautious that you miss the wind. This strategy requires a keen eye and a steady hand, as the goal is to minimize losses while still allowing room for the stock to breathe and grow.
The Untold Stories of Chart History
Time Traveling Through Trends
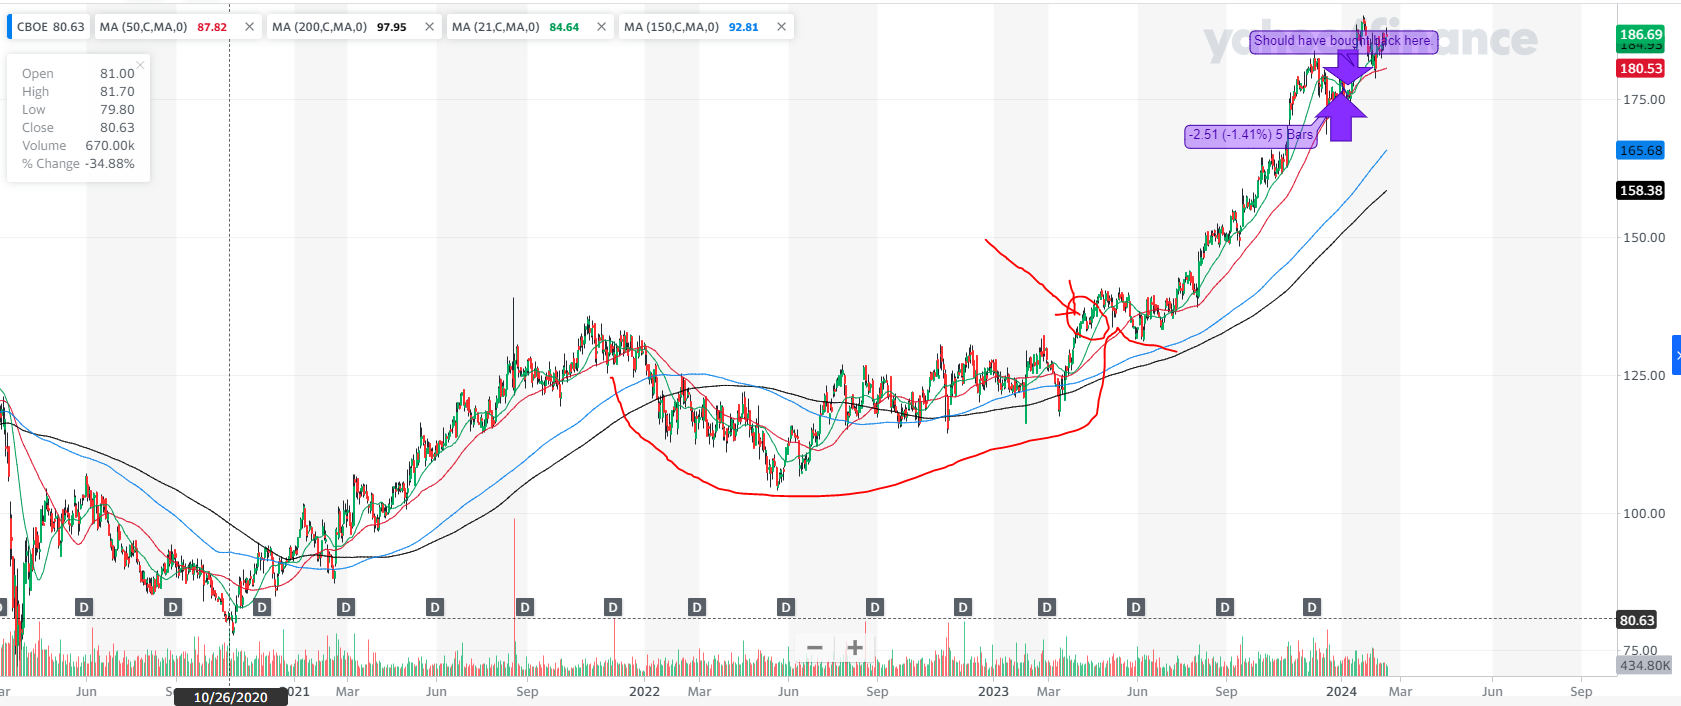
The history of a stock chart is a saga filled with rises and falls, triumphs and defeats. Each phase of the stock’s journey holds clues to its future behavior. Skipping this exploration is like trying to follow a story from the middle—confusing and unsatisfying. By understanding the stock’s past, you can better predict its future, spotting potential uptrends before they become obvious to the untrained eye.
Reading Between the Lines
Analyzing the historical data of a stock allows you to identify patterns and trends that recur over time. This process is akin to learning the language of the market, where each movement has significance, and every trend tells a tale. By becoming fluent in this language, you unlock the ability to anticipate the market’s next move, giving you an edge over those who rely on superficial glances.
Crafting Your Market Masterpiece
The Tools of the Trade
Armed with the knowledge of recent lows and historical trends, you’re now equipped with the tools to craft your strategy. But remember, the stock market is not a static entity; it’s a dynamic, ever-changing beast. Continuously refining your approach, learning from your successes and failures, and staying informed about market conditions are crucial to your success.
The Path to Proficiency
Becoming proficient in stock chart analysis is not an overnight journey. It requires patience, persistence, and a willingness to learn. Start small, take notes, and don’t be afraid to ask questions. The more you immerse yourself in the market’s language, the more fluent you’ll become. And remember, every investor makes mistakes—it’s how you learn from them that counts.
Details at a glance

The big picture

Opening
- Underlying: CBOE
- Date: 29 Dec 2023
- Underlying Price: 178.52
- Stop Loss: 172.99
- Profit Target: 196.56
- Market Outlook: Confirmed uptrend
- RS Rating: 86
- Position Risk, %: 3.08
- Position Risk to NL, %: 0.25
- Potential Profit (Position), %: 10.05
- Risk to Reward Ratio: 0.31
- Position Size, %: 7.96
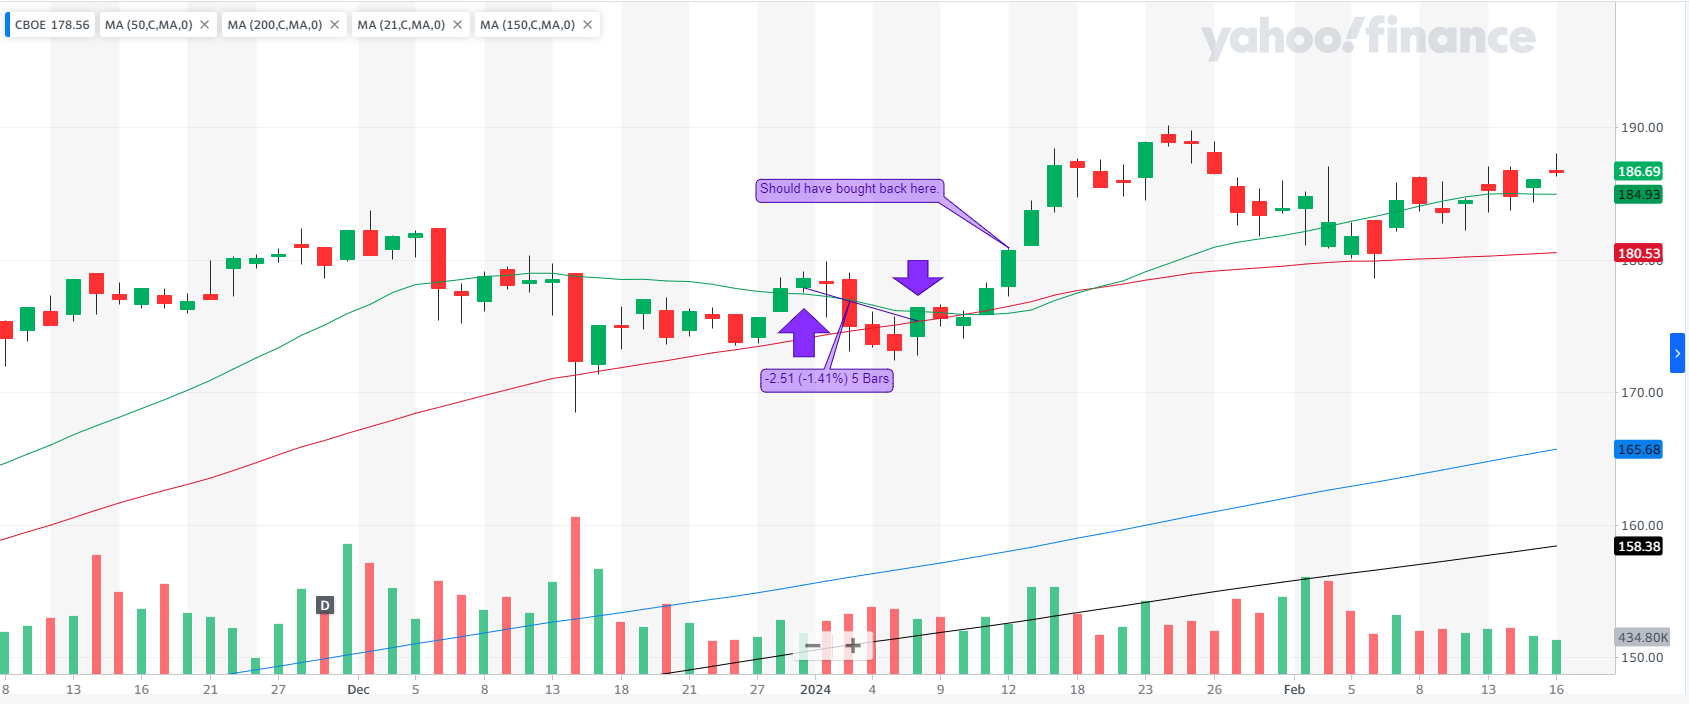
- Reason for Opening Trade: Bought back previously owned stock because price broke above EMA 21. Considered a low-risk trade due to the positive market reaction to the earnings release.
- Ideal Buy Assessment: No, the price wasn’t in the base, and the up volume was relatively low.
closing
- Follow-up Date: 8 Jan 2024
- Price (Close): 173.78
- Market Outlook (Follow-up): Confirmed uptrend
- RS Rating (Follow-up): 86
- RS Change: 0
- Remarks: Price fell below SMA 50. RS line in a downtrend.
- What Went Well: Loss was minimized by keeping an eye on the stock, preventing significant extension from key moving averages.
- Cause of Error/Improvement: Needed to use price alerts for re-buying at optimal levels. Should pay closer attention to undercuts of previous lows and key moving averages, avoiding direct stop-loss placement below moving averages to account for potential bounces.
- Lessons Learned: Timing trades is crucial, especially in less obvious trends. The optimal time for this trade would have been June 2023 when the stock was trading in the 130 range.
- Position ROI, %: -3.75
- Position ROI (Portfolio), %: -0.30
- Position Open Time (Trading Days): 5
- Position Open Time (Days): 10
Conclusion: Beyond the Glance
In conclusion, while a glance at a stock chart might give you an impression, it’s the deeper analysis that reveals the market’s true story. By paying attention to recent lows and diving into the chart’s history, you equip yourself with the knowledge to navigate the stock market’s turbulent waters more effectively. The market is a complex tapestry woven from countless threads—by learning to read these threads, you can turn your investments into a masterpiece.


