Ever wondered how some stocks bounce back strong like a tennis ball? Let me show you how I leverage my trades with a tennis ball action strategy for stock trading!
It’s a fascinating sight, and it also holds a valuable lesson for stock trading. This blog will take you through my recent experiences with CNM stock, showcasing the highs and lows, and introduce you to the concept of tennis ball action.
My CNM Journey: The Ups and Downs
I’ve had a thrilling ride with CNM stock using a tennis ball action strategy for stock trading. Here’s a glimpse of my journey:
First Position:
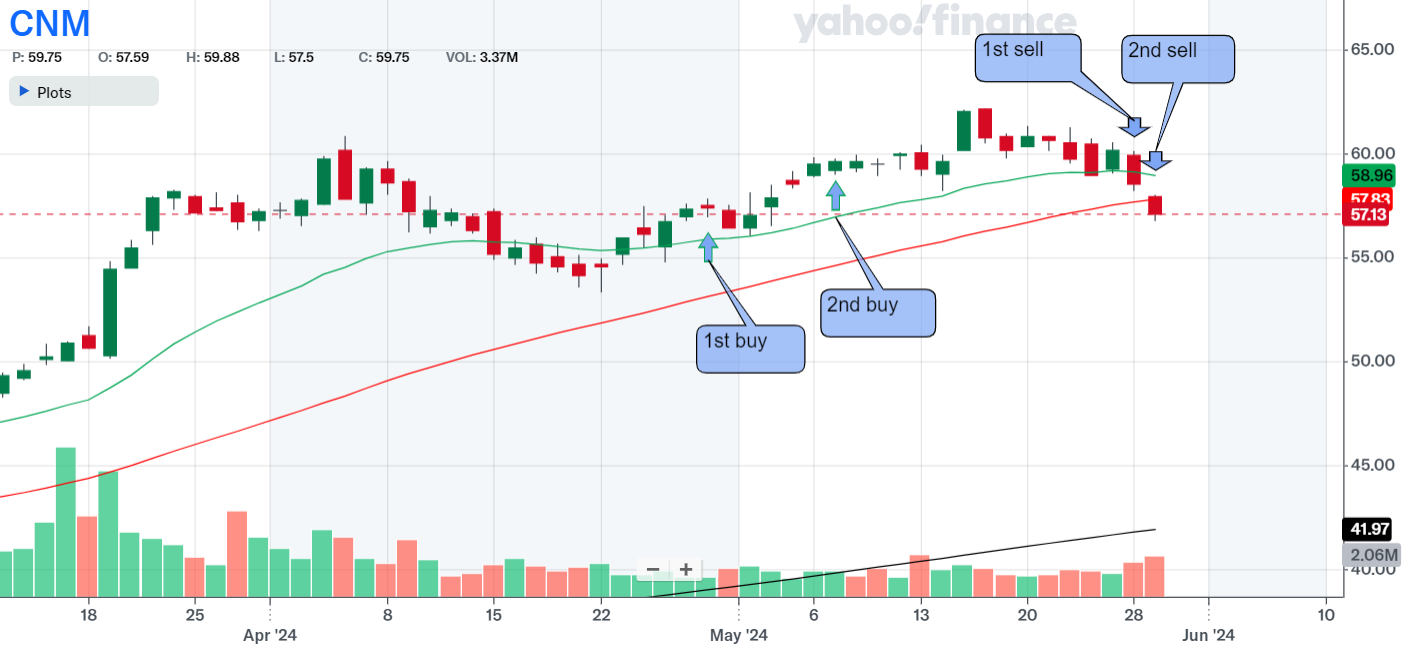
- Bought on: April 29, 2024, at $57.12
- Sold on: May 28, 2024, at $58.20
- Result: Small gain of 0.15%
What Went Well:
- Bought when the stock broke above the EMA 21 line.
- Recognized institutional accumulation.
Room for Improvement:
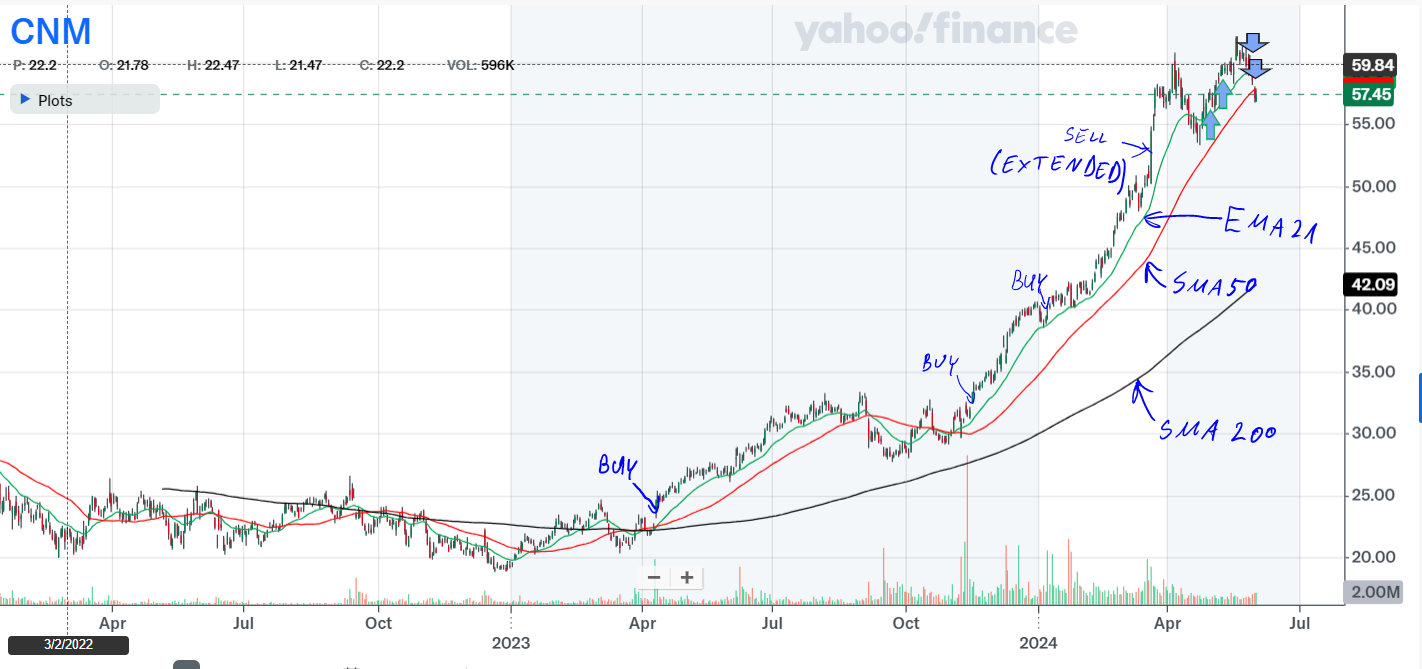
- Missed an earlier entry point in April 2023.
- Failed to keep the stock on my radar for a better buy.
Second Position:
- Bought on: May 7, 2024, at $59.54
- Sold on: May 30, 2024, at $57.95
- Result: Loss of 4.31%
What Went Well:
- Implemented a tight stop-loss.
Room for Improvement:
- Should have raised the stop-loss after the first position was stopped out.
- Did not get the expected price due to large price swings.
The Concept of Tennis Ball Action
You might wonder, what’s this tennis ball action all about? It’s a brilliant metaphor coined by Mark Minervini to describe a stock’s strong rebound after a dip. Just like a tennis ball bouncing back after being dropped, certain stocks exhibit this resilient behavior. Here’s how you can spot and use it:
Key Aspects of Tennis Ball Action:
- Strong Rebound: Look for stocks that quickly recover after a decline.
- Technical Conditions:
- At least 9 out of the last 15 closes should be in the upper 50% of the price range.
- Presence of a bullish engulfing candlestick pattern.
- High buying volume on rebound days compared to the selling volume during the dip.
- Moving Averages: Stocks often find support at key moving averages like the 21-day EMA and 50-day SMA.
Application in Trading:
- Entry Points: Look for strong bounce-back signals from significant support levels.
- Risk Management: Set stop-losses below key support levels to limit downside risk.
- Trend Confirmation: Use multiple technical confirmations to affirm the upward trend’s robustness.
trade details at a glance
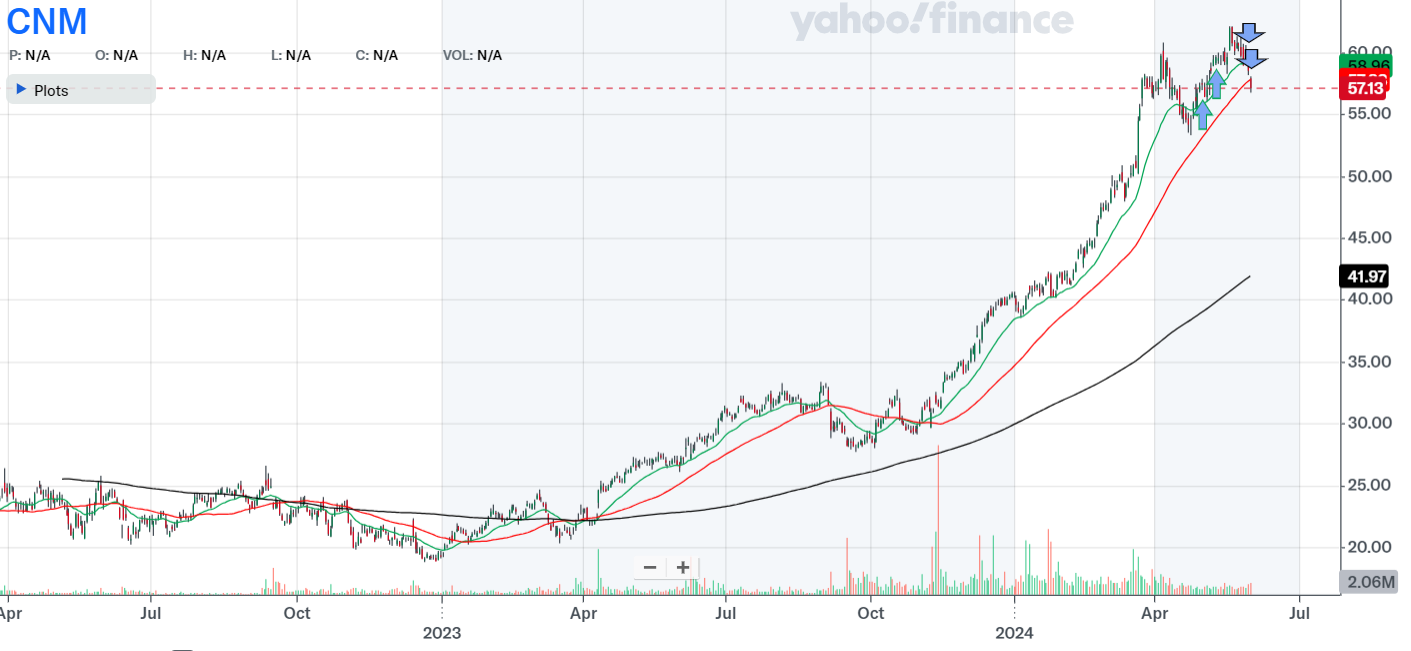
Explanations for the Drawings: The upward purple arrow shows where I bought the stock. The downward purple arrow shows where I sold it.
Green Line 21-day exponential moving average line (see EMA 21 below)
Red Line 50-day simple moving average line (see SMA 50 below)
Black Line 200-day simple moving average line (see SMA 200 below)
The big picture of the CNM stock price chart:

Position openings and closes:

first position
Opening
- Underlying: CNM
- Date: 29 Apr 2024
- Underlying Price: 57.12
- Stop Loss: 55.39
- Position risk, %: 2.99
- Position Risk to NL, %: 0.16
- Profit Target: 68.54
- Potential Profit (position), %: 19.83
- Risk to Reward Ratio: 0.15
- Market Outlook: Confirmed uptrend
- RS Rating: 97
- RS line trend (U/N/D): U
- Industry Rank (X / 197): 8
- Volume U/D Ratio: 1.9
- Institutional Ownership Trend (U/N/D): U
- Position size, %: 5.21
- Why did I open this trade at that point?: I bought the stock because the price broke above EMA-21 line.
- Was it an ideal buy?: No. The price was not in the buy zone.
- Remarks:
- Uptrend is somewhat old and the price has appreciated a lot from the base.
- The stock is clearly accumulated by the institutions and overall market.
Closing
- Date: 28 May 2024
- Price (close): 58.20
- Market Outlook: Confirmed uptrend
- RS Rating: 96
- RS Change: -1
- Remarks: The stock started to slide. Half of the position was stopped out.
Results
- What went well?:
- I made the purchase once the stock had broken above the EMA 21 line.
- I made sure that the stock was accumulated by the market and by the institutions.
- Even though the uptrend of the stock price was old, I was aware of it and took the calculated risk when I bought it.
- I sold the stock once it fell below key moving averages.
- Cause of Error / IMPROVE: I should have bought in April 2023 and held the stock on the radar since that time.
- Lessons Learned:
- I need to keep an eye on the stocks that are on the verge of breaking out of a base. This one again wasn’t the case.
- This one was a ‘Tennis ball action’ case which also works and is a much more common price pattern.
- Position ROI, %: 0.15
- Position ROI (portfolio),%: 0.01
- Position Open Time (trading days): 21
- Position Open Time (days): 29
second position

tennis ball action explained
Mark Minervini’s “tennis ball action” is a metaphorical concept he uses to describe a stock’s strong rebound behavior after a pullback, akin to a tennis ball bouncing back after being dropped. This concept is used to identify stocks that exhibit resilience and bullish momentum, which are characteristics Minervini looks for in potential investment opportunities.
Key Aspects of Tennis Ball Action:
- Strong Rebound After a Dip: The idea is to find stocks that, after experiencing a decline, quickly recover and continue their upward trend. This rebound is similar to how a tennis ball bounces back when thrown down hard.
- Technical Conditions: Minervini uses several technical indicators to confirm this action, including:
- Upper 50% Range Condition: At least 9 out of the last 15 closes should be in the upper 50% of the price range.
- Bullish Engulfing Pattern: A bullish engulfing candlestick pattern indicates strong buying pressure.
- Positive Volume Trends: High buying volume on the rebound days compared to the selling volume during the dip.
- Moving Averages: Stocks often find support at key moving averages like the 21-day EMA (Exponential Moving Average) and the 50-day SMA (Simple Moving Average) (TradingView) (useThinkScript Community).
- Behavior After Breakout: Post breakout, a stock should ideally not only stay above its breakout point but also show increased buying interest and reduced selling pressure, confirming the bullish sentiment.
Application in Trading:
- Entry Points: Traders look for strong bounce-back signals from significant support levels like moving averages or previous resistance-turned-support zones.
- Risk Management: Setting stop-losses below these key support levels ensures limited downside risk. For instance, Minervini emphasizes using a stop-loss at the 50-day SMA to avoid significant losses if the trade doesn’t go as expected (studylib.net) (StockScreener.com).
- Confirmation of Trend: Multiple technical confirmations, such as sustained closes in the upper range and bullish patterns, help affirm the robustness of the upward trend and the likelihood of continued strength.
Practical Example:
A stock demonstrating tennis ball action would show a rapid recovery with high volume buying after a dip, consistently closing in the upper half of its trading range, and finding support at key moving averages. This pattern suggests strong underlying fundamentals and positive market sentiment, making it a favorable candidate for trading according to Minervini’s strategy (Rattibha).
This approach helps traders identify high-potential stocks that are likely to continue their upward trajectory, providing clear guidelines for entry and exit points to maximize returns while managing risks effectively.
Lessons Learned

From my CNM adventure, I’ve learned the importance of keeping an eye on potential breakout stocks and recognizing the Tennis Ball Action Strategy for Stock Trading. This approach can help maximize returns while managing risks effectively.
And now, armed with these insights, are you ready to spot your own Tennis Ball Action Strategy for Stock Trading opportunities? Keep bouncing back, and happy trading!
And here’s a zinger to wrap things up: Remember, in the stock market, just like in tennis, it’s all about the bounce-back!
By the way, if you have any thoughts or questions about trading or investing, fill out the form here and I’ll get back to you.

