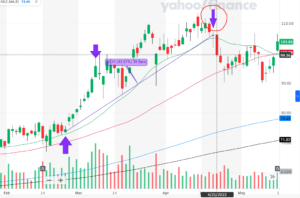
Just suppose you can get a deal like this: 23.8% in 2 weeks! Imagine jumping into a strategy and immediately catching a wave that delivers a whopping 23.8% return in just two weeks.
That’s exactly what happened when I embarked on my first venture with CAN SLIM. It sounds almost too good to be true, like finding a shortcut in a traffic jam that nobody else knows about.
The Rhythm of Success
I started with a clear plan, opening and closing positions in three strategic phases between February 23, 2022, and March 7, 2022. It was like hitting every green light on your way to an important meeting. This approach didn’t just boost my confidence; it deeply ingrained the rhythm of the market in my strategy.
Hitting the Bull’s Eye on the First Shot

Explanations for the Drawing
The upward purple arrow shows where I bought the stock. The downward purple arrow shows where I sold it.
Green Line 21-day exponential moving average line (see EMA 21 below)
Red Line 50-day simple moving average line (see SMA 50 below)
Black Line 200-day simple moving average line (see SMA 200 below)

Achieving an average return of 23.8% in such a short period wasn’t luck; it was about making smart decisions at the right time. Setting and hitting precise profit targets felt as satisfying as nailing a bullseye when you need it most. This success was a testament to the power of a well-executed plan.
definitions

EMA 21 Calculates the 21-period exponential moving average, highlighting short-term trends.
SMA 50 Averages the price over 50 periods, showing medium-term trends without overemphasizing recent data.
SMA 200 Averages the price over 200 periods, revealing long-term trends by treating all data equally.
Industry Rank Investor’s Business Daily’s system that ranks industries 1 to 197 based on performance. It guides us in CAN SLIM TRADING towards leading sectors.
U/D Ratio Measures stocks closing up versus down. A ratio above 1.0 indicates bullish sentiment, important in CAN SLIM TRADING.
RS Rating Ranks a stock’s performance on a 1 to 99 scale. I look for at least 85, showing strong momentum and growth potential.
RS Line Compares stock price to the market, plotted as a ratio. We seek an uptrend, indicating outperformance and strong momentum.
Volatility Measures how much a security’s price fluctuates over time. High volatility means large price changes, indicating risk and potential reward.
Institutional Ownership Trend indicates whether the stock is under accumulation or distribution by the institutions.
EPS (Earnings Per Share): A financial metric calculated by dividing a company’s net profit by the number of its outstanding shares. It indicates the amount of profit attributed to each share of stock, serving as a key indicator of a company’s profitability.
The Game-Changing Decision

When I saw the stock price begin to climb, I was faced with a choice. The easy path would have been to hold on and see how high it could go, but I stuck to my plan and cashed out after hitting my target. It was like opting to walk away from the roulette table with winnings in hand, rather than betting it all on another spin.
Tweaking for Even Greater Gains
Influenced by the strategic wisdom in O’Neil’s teachings, I refined my rules. Now, if a stock jumps 20% in three weeks, I’ll hold it for at least 8 weeks. It’s like adjusting your strategy in a board game to maximize your chances of winning in the long run.
A Calculated Departure
Though I sometimes wonder about the gains I left on the table, the decision to sell was validated by subsequent market volatility. It’s a classic scenario of better safe than sorry, akin to leaving a party at the right time before things get out of hand.
Mastering the Art of Discipline
If there’s one thing I’ve learned, it’s that discipline is crucial. It forms the bedrock of successful trading, supporting every decision like a reliable old bridge supports traffic. This journey has not just been about making profit; it’s been about proving a point: with the right discipline, anyone can transform their trading results.
Emotional Wisdom
The process taught me to manage not just my investments, but also my emotions—detaching from the highs and lows like a seasoned captain navigating stormy seas.
Keeping Ego in Check
I also learned to keep my ego in check, balancing the thrill of potential gains with the reality of smart, strategic play. It’s about not letting your ego write checks your skills can’t cash.
The Power of a Plan
What really matters isn’t just making the right moves, but having a robust plan and sticking to it through thick and thin. This adaptability and continuous improvement are what turn good traders into great ones. It’s less about being right or wrong on any given day and more about growing stronger over each trading cycle.
Building on Every Trade

Every trade teaches a new lesson, adding another tool to my kit. It’s like collecting keys; eventually, you find the one that unlocks the door to consistent success.
And here’s the kicker: if trading can be this straightforward and profitable from the get-go, just imagine what’s possible with a little experience and a lot of discipline. So, here’s to making every trade count and transforming the simple into the spectacular!


