Are you ready to SUPERCHARGE YOUR PORTFOLIO with some of the market’s hottest stocks? Try out 15 hot stocks ready to explode! Additionally, I’m giving you more detailed information of the TOP 3 stocks in the list.
For the top 3 leaders, I’ll provide exact buying and selling points. This ensures you can take precise action for maximum gains. The market is in an uptrend, making this an ideal time to invest.
Dive in and discover the potential winners poised for breakout. With this list, you’ll be equipped to navigate the market with confidence and capitalize on emerging opportunities.
MARKET OVERVIEW
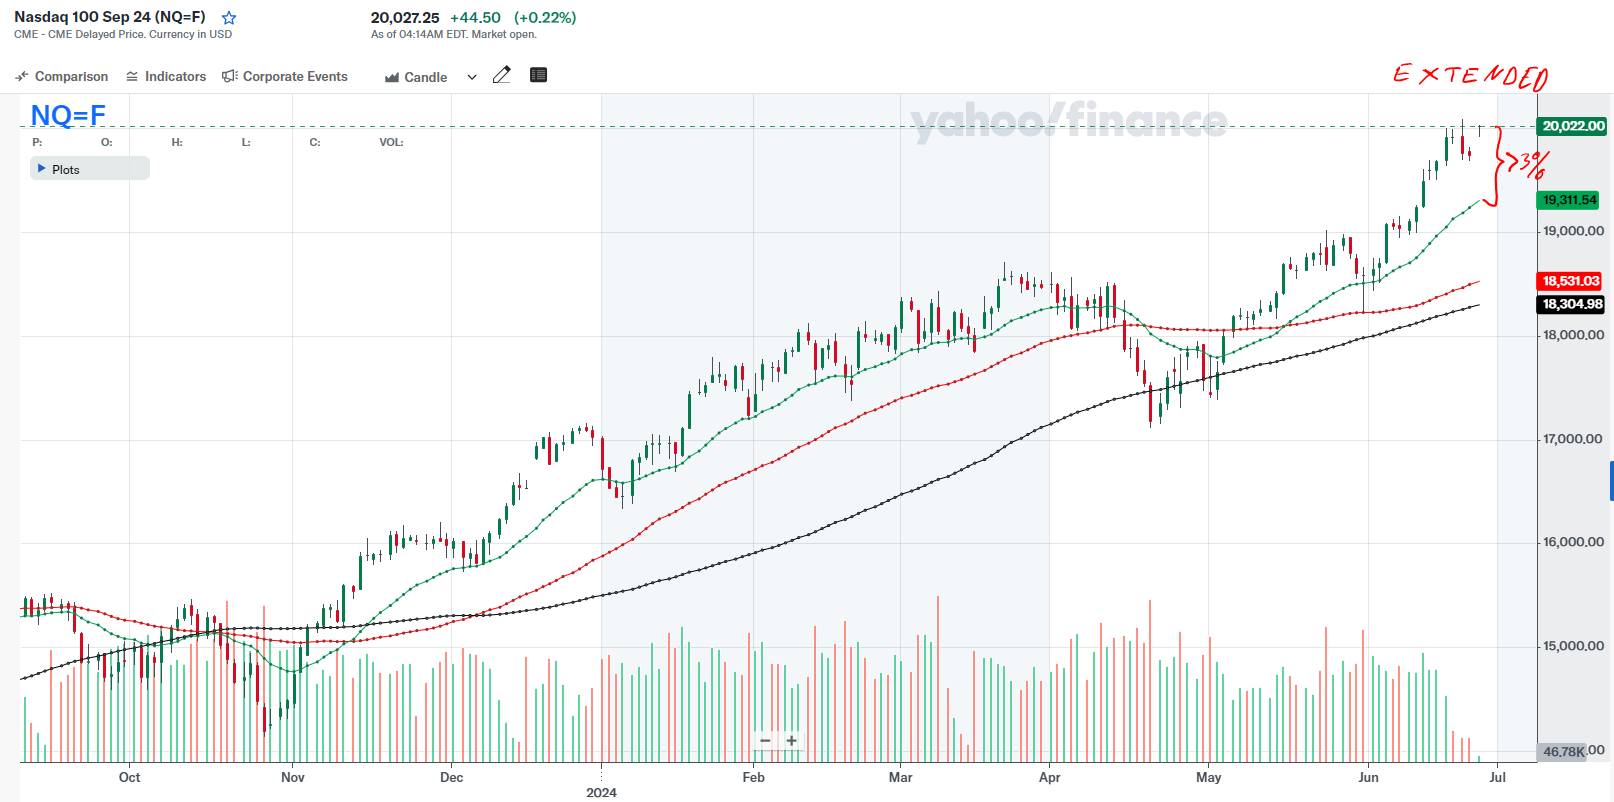
The overall market is in an uptrend. The Nasdaq 100 is slightly extended, with its price at the upper channel line and above all key moving averages. It appears to be giving back some of its gains, with a couple of down days on relatively high volume, so we need to be cautious.

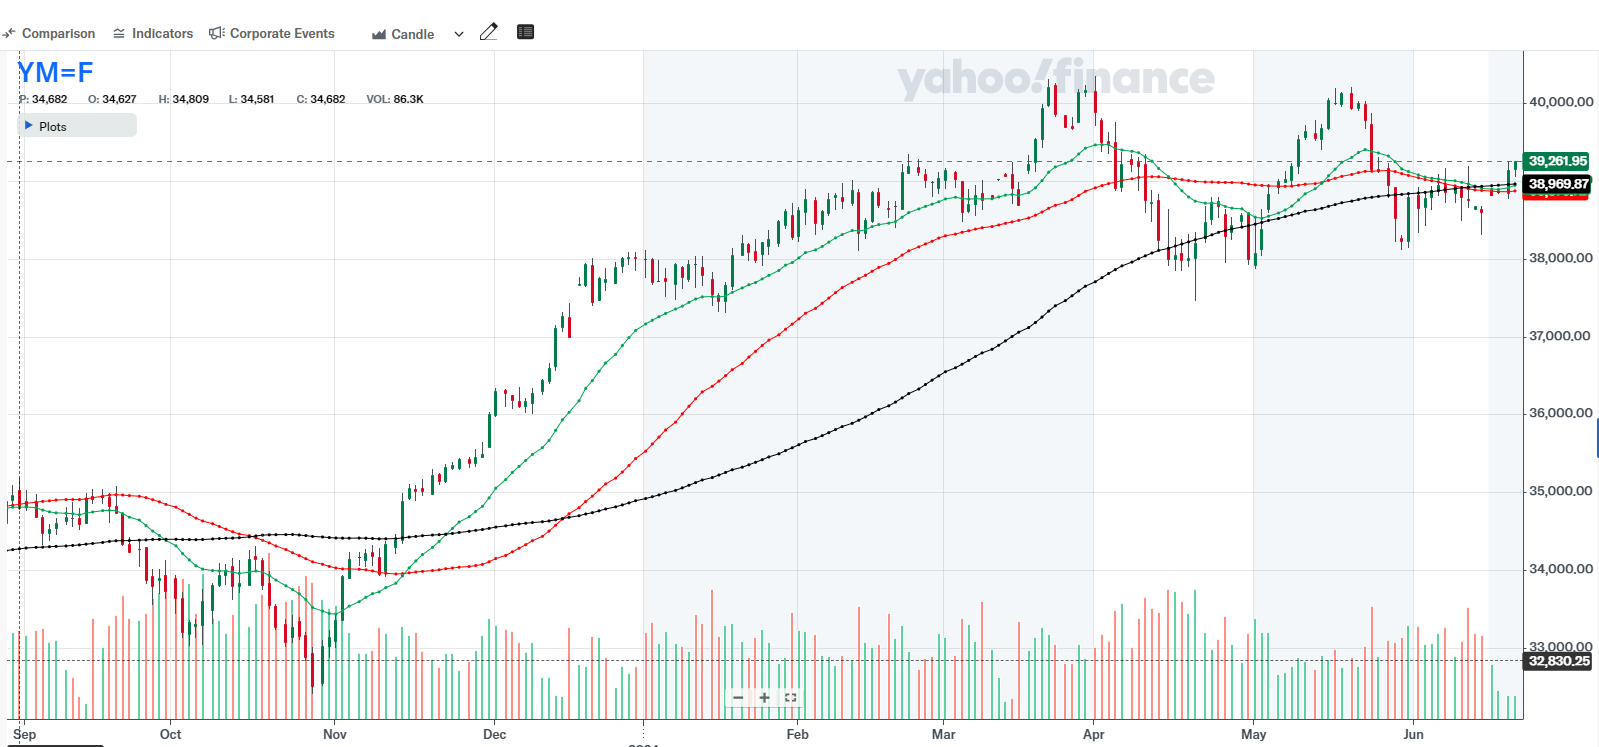
The Dow Jones Industrial Average is at its key moving averages. In the last few days, there have been gains with strong volume. This might indicate money moving from tech to industrials, but we don’t know for sure yet.

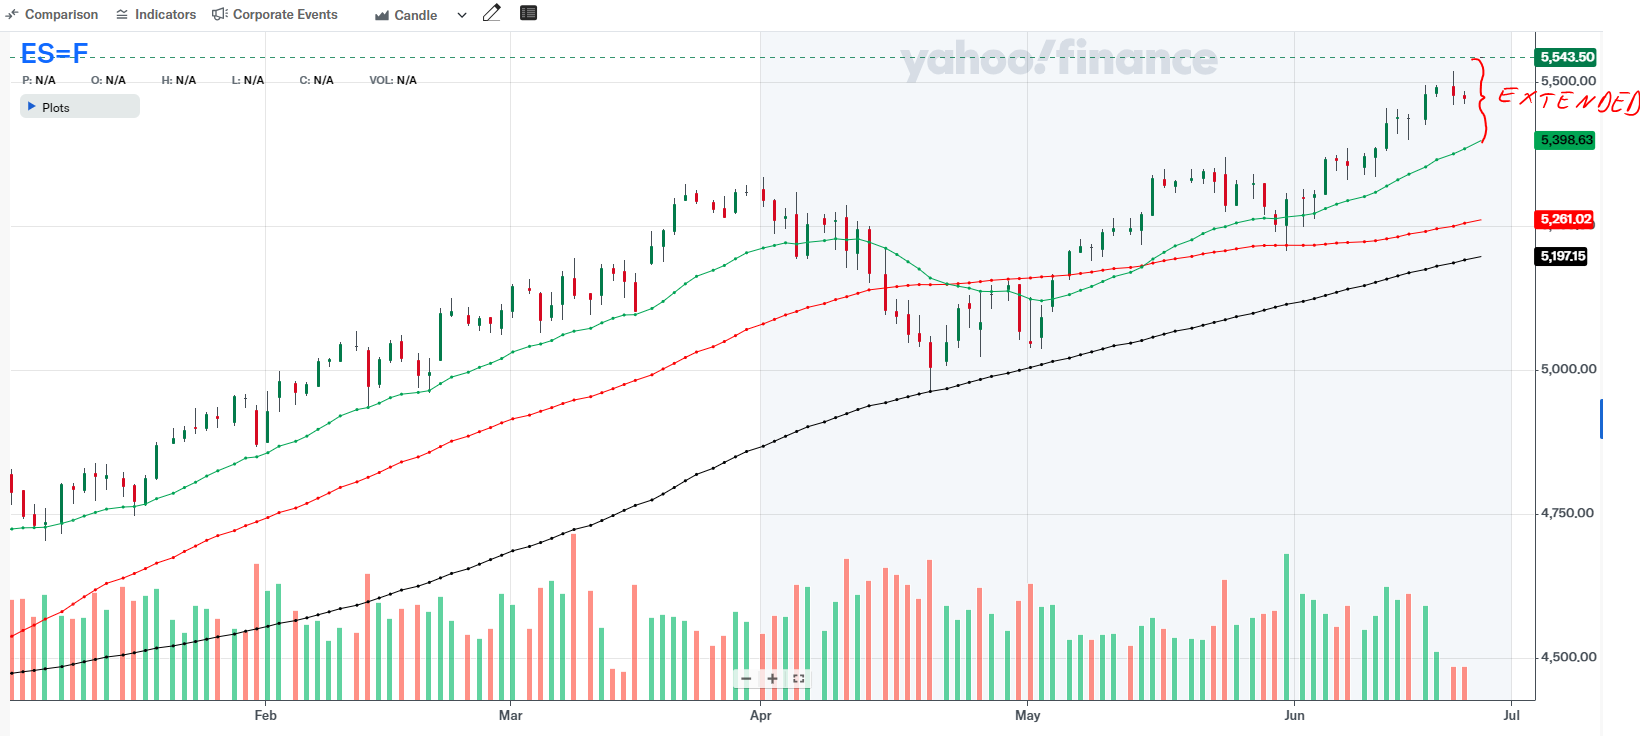
The S&P 500 is in a similar situation to the Nasdaq but less extended. If you want to buy the ETF for the S&P 500, now seems to be a good time as the price is in the buy zone. However, there have been two strong down days, so if the downward trend continues, we need to be careful.

Overall, it’s summertime, and the markets tend to be more volatile because institutions usually cut back their positions, and there are relatively more small investors trading. Small investors rely more on their emotions, making the prices more volatile.
Celestica (CLS)
- Industry Rank: 16/197
- Buying Point: $57.50
- Stop-loss: $54.56
- Profit Target: $66.34
- Pros:
- Very strong stock with good fundamentals.
- Leading industry.
- The stock is accumulated by the market and by the institutions.
- Cons: The stock is not forming a base and it hasn’t done it for a while
It would make sense to take a small (up to 5%) position between EMA 21 line and 55.83 and see how it will turn out. The stop-loss price should be relatively high, since the price is not breaking out of a base and adds a little risk.
Nvidia (nvda)
- Industry Rank: 2/197
- Buying Point: $122.77 or less
- Stop-loss: $117.86
- Profit Target: $137.50
- Pros:
- Very strong stock with good fundamentals.
- Leading industry.
- The stock is accumulated by the market and by the institutions.
- Cons: The stock is not forming a base and it hasn’t done it for a while.
If the price should fall to the 122 area or somewhere near that and then find some support, it would be reasonable to take a small position as an initiation. By that time, the price would be within a 3% range relative to the EMA 21 line. The stop loss should be placed below the EMA 21. It would not be reasonable to place a stop loss very far from the buying point because the price is not breaking out of the base right now, which adds a little bit of risk.
pinterest (pins)
- Industry Rank: 28/197
- Buying Point: $43.68 or less
- Stop-loss: $40.62
- Profit Target: $52.85
- Pros:
- The price of the stock is in the 1-st stage buy zone. This gives a lot of potential for the upside movement.
- The stock is accumulated by the market and by the institutions.
- Cons: The industry rank for the stock is a little bit low. This adds a little bit of risk.
This is a good stock, and it is clearly under accumulation because the up/down ratio is more than 1, and the institutional ownership trend is rising. The stock has broken out of the base and is in the buy zone right now. The base was from the first stage, which means it has a lot of upside potential. The only small obstacle is that the industry rank for the stock is a bit low, which adds some risk to the price. However, it is not very low; it’s 28 out of 197. It would be preferable if the industry rank was 20 or less. Other than that, it makes sense to take a position in this stock. The position can be up to 10%. Of course, you can scale in, taking a 5% position as an initiation, for example.
12 more market leaders
Here’s a list of 12 more stocks that caught my eye and that are on my ready-to-go watchlist. The sequence starts with the best performer:
| SFM | Sprouts Farmers Market |
| THC | Tenet Healthcare |
| QCOM | Qualcomm |
| PSTG | Pure Storage Cl A |
| FN | Fabrinet |
| GSL | Global Ship Lease Cl A |
| TXRH | Texas Roadhouse |
| CROX | Crocs |
| GOOGL | Alphabet Cl A |
| SEM | Select Medical Holdings |
| LOGI | Logitech International |
| AMZN | Amazon.com |
keynotes
We must remember that investing or trading stocks is a defensive play and there are no guarantees!
We should never take any position without either a mental or physical stop loss. This is crucial because many positions may decline after you take them, and a down stock equals a down portfolio. The #1 goal is not to be right but to make money or avoid losing it. The U.S. stock market is quite volatile, which means it can rapidly go up or down, so we need to cap the downside.
conclusion
There you have it! Right now, there is a green light for taking or increasing positions. We need to keep an eye on the overall market and also on the stocks that are moving upward. It is always better to buy stocks with lower volatility. It is especially good if the volatility has contracted lately, as this would be a strong sign.
additional information
TERMS AND DEFINITIONS

Ever felt like trading lingo was designed just to keep amateurs out of the loop? Let’s simplify a couple of terms:
EMA 21 Calculates the 21-period exponential moving average, highlighting short-term trends.
SMA 50 Averages the price over 50 periods, showing medium-term trends without overemphasizing recent data.
SMA 200 Averages the price over 200 periods, revealing long-term trends by treating all data equally.
Pivot price is the optimal buy point of a stock is defined as the moment it transitions from a stable basing area or chart pattern and begins to achieve new highs in price.
Industry Rank Investor’s Business Daily’s system that ranks industries 1 to 197 based on performance. It guides us in CAN SLIM TRADING towards leading sectors.
U/D Ratio Measures stocks closing up versus down. A ratio above 1.0 indicates bullish sentiment, important in CAN SLIM TRADING.
RS Rating Ranks a stock’s performance on a 1 to 99 scale. I look for at least 85, showing strong momentum and growth potential.
RS Line Compares stock price to the market, plotted as a ratio. We seek an uptrend, indicating outperformance and strong momentum.
Volatility Measures how much a security’s price fluctuates over time. High volatility means large price changes, indicating risk and potential reward.
Institutional Ownership Trend indicates whether the stock is under accumulation or distribution by the institutions.
EPS (Earnings Per Share): A financial metric calculated by dividing a company’s net profit by the number of its outstanding shares. It indicates the amount of profit attributed to each share of stock, serving as a key indicator of a company’s profitability.
STAGE 1: BASING OR BOTTOMING STAGE
Definition: A period following a stock’s decline where it starts moving sideways, forming a base. This stage signifies the easing of downward pressure and the beginning of stabilization, indicating that the stock is not in an uptrend yet but is preparing for potential future growth.
STAGE 2: ADVANCING OR UPTREND STAGE
Definition: The phase in which a stock breaks out of its base on significant volume, indicating a strong buying interest and the initiation of a new uptrend. This stage is considered the most opportune time for investors to purchase the stock, as it is expected to achieve substantial gains.
STAGE 3: TOP OR PEAKING STAGE
Definition: A stage characterized by the stock beginning to exhibit signs of losing momentum after its upward movement. The stock may start to move sideways with increased volatility compared to Stage 1. This suggests the stock might be reaching its peak, and the existing uptrend could be weakening.
STAGE 4: DECLINING OR DOWNTREND STAGE
Definition: This final stage occurs when the stock breaks down from its Stage 3 pattern and enters into a downtrend, marked by a sequence of lower lows and lower highs. It signifies that selling pressure has surpassed buying interest, usually serving as a signal for investors to sell the stock to mitigate further losses.
p.s.
If you have any thoughts or questions about trading or investing, fill out the form here and I’ll get back to you.


