Do you understand THE LINGO IN STOCK TRADING? Even if you are a part-time investor/trader, the more you know the better it is for your results. Read the article and you will be one step further. PLUS you’ll discover the most important virtue traders must develop.
Mark Minervini describes tennis ball / broken egg action like this:
It’s during pullbacks you get to see what a stock is really made of. Does it come bouncing back like a tennis ball or splat like an egg? The best stocks rebound the fastest. Once I buy a stock, if it displays tennis ball action, I will probably hold it longer.
trade setup
At the end of May this year, the stock of a gold mining company Agnico Eagle Mines Limited (AEM) came to my radar because its price was close to its key moving average. Why is this important?
Usually, good stocks tend to bounce up from their key moving averages, which is a good low-risk opportunity to make some money.
Also, the volume higher than usual confirmed the market’s interest in the stock:
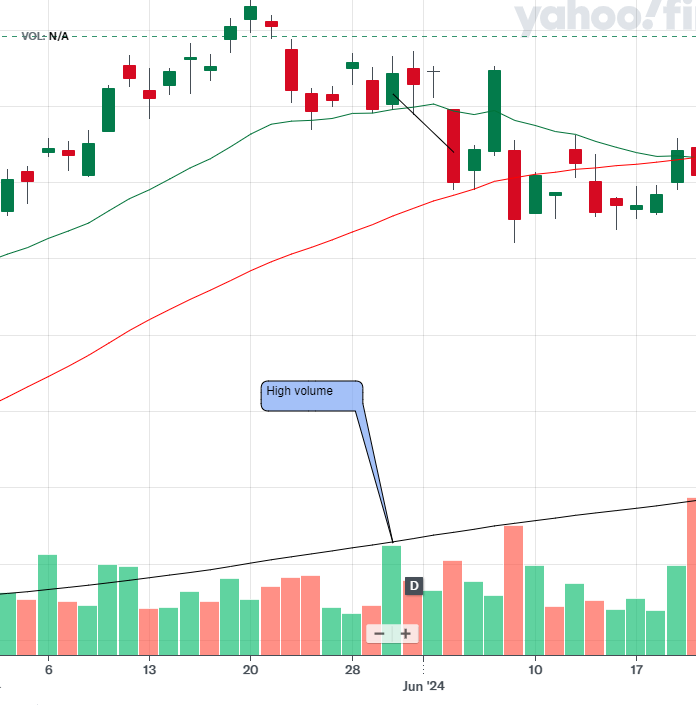
If you are interested in what these lines represent in the drawing, scroll down and see the explanations.
Although my main interest is to buy the stocks that are breaking out of their bases or have just broken out, this is the next best thing – buying when the price comes close to the key moving average such as the 21-day exponential moving average (EMA 21) or 50-day simple moving average (SMA 50). So far so good…
taking position
So, I took the position with the price of 68.96$ and set the stop-loss to the price level of 66.64 which was slightly below EMA 21 at that time. Is it necessary to place a stop-loss below the moving average? Why?
Simple reason: moving averages tend to act as invisible walls – if the price touches it or goes just slightly through it, it usually bounces back to another direction like a tennis ball hitting a wall.
Going through the moving average requires extra power and momentum.
So, what happened next?
this is what happened next
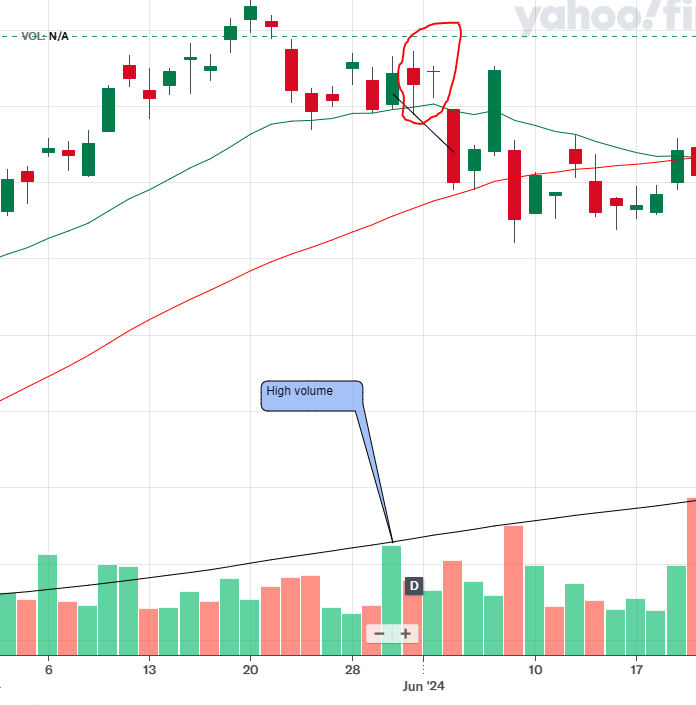
A couple of days after taking a position, things seemed to go as planned. The price of the stock kept going above the EMA 21 line. See the red circle:
And then… Boom!
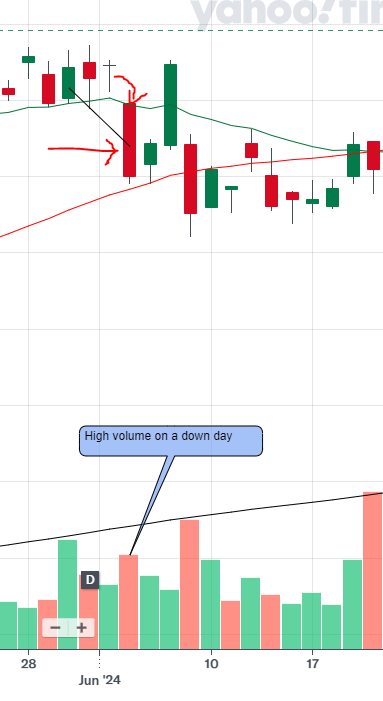
The stock broke below the key moving average (EMA 21) with a relatively high volume. The price splatted like an egg to the ground.

What to do when this kind of situation happens?
Close immediately? Hope that the price will come back up?
Experience shows that there is no room for hope. The best thing to do is to act according to the plan.
This is where the pre-determined stop-losses and profit targets come in.
What did I do?
closing
Since the price fell so rapidly, my position was stopped out by the broker. I had set my stop-loss to the price of 66.34.
The price of the stock fell through this level and the stop-order turned into a market order and liquidated my position with the price of 66.31, slightly below the stop price.
Do I always wait for the broker to sell my positions that are at a loss?
the most important virtue of a stock trader
Do you know what it is? Is it buying at the right time? Picking the right stock? Being stoic? Planning? Is it something else?
All of the examples above are good features BUT this has proven to be the most important:
BEING THE FASTEST SELLER POSSIBLE.
Why? Because very often you pick the right stock.
And you time the buying correctly and so on. But then the market turns against us and drags almost all of the stocks down. Even the good ones.
You don’t know how long this will last or how low the price will go.
We’ll never know that. Also, we won’t know when and if they will go up again.
So, the best thing we can do is to get out of the stock when things turn bad. Is this the end of trading this stock? Was your research for the stock a waste of time? Not necessarily.
ALWAYS KEEP ALL THE GOOD STOCKS ON THE RADAR!
If you do this for a while you will have a list of good stocks that you have analyzed. Then you can open and close positions, using mainly only these stocks, and the need for researching new stocks will go down.
Updating the analysis you have done takes much less time and energy than starting from zero.
details at a glance
Explanations for the Drawing: The upward purple arrow shows where I bought the stock. The downward purple arrow shows where I sold it.
Green Line 21-day exponential moving average line (see EMA 21 below)
Red Line 50-day simple moving average line (see SMA 50 below)
Black Line 200-day simple moving average line (see SMA 200 below)
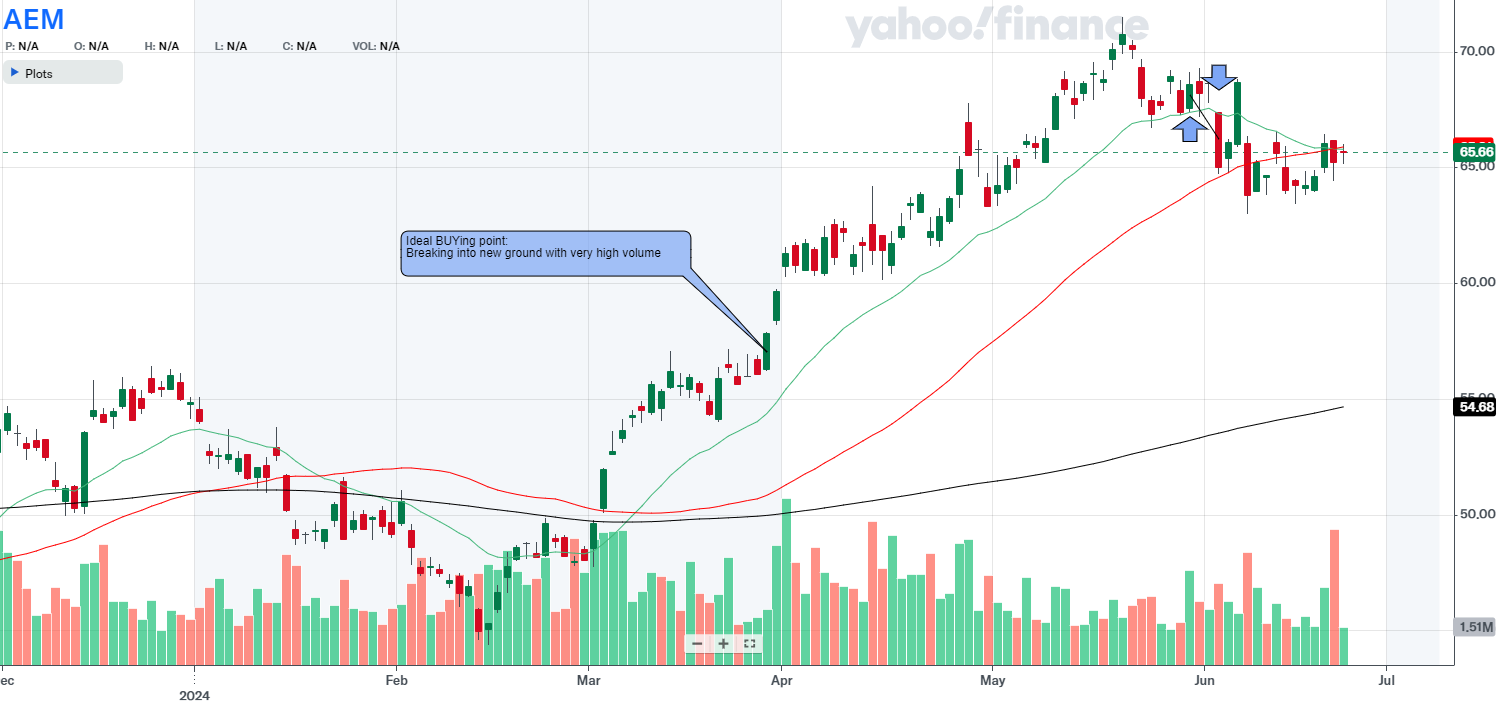
See the ideal buying point in the middle of the drawing. It would have been the best time to buy the stock once it broke into new ground with strong volume.
This indicated a strong move which often proceeds with an uptrend. Unfortunately this time, I didn’t catch it and bought the stock later.
Opening
- Underlying: AEM
- Date: 30 May 2024
- Underlying Price: $68.96
- Stop Loss: $66.34
- Position Risk, %: 3.77%
- Position Risk to NL, %: 0.24%
- Profit Target: $82.75
- Potential Profit (position), %: 19.86%
- Risk to Reward Ratio: 0.19
- Market Outlook: Confirmed uptrend
- RS Rating: 92
- RS Line Trend (U/N/D): U
- Industry Rank (X / 197): 9
- Volume U/D Ratio: 2.0
- Institutional Ownership Trend (U/N/D): N
- Position Size, %: 6.30%
- Why did I open this trade at that point?: I took the position because the price of the stock bounced up from the EMA 21 line (tennis ball action) with higher than usual volume.
- Was it an ideal buy?: No. The price of the stock was not breaking out of a base and volume was less than 40% above the average daily volume.
- Remarks: The stock is clearly in the leading industry (rank 9 out of 197) and is being accumulated by the market (volume U/D ratio 2.0).
Closing
- Date: 4 Jun 2024
- Price (close): $66.31
- Market Outlook: Confirmed uptrend
- RS Rating: 90
- RS Change: -2
- Remarks: The stock price broke below the 21-day exponential moving average, so this means that the tennis ball action turned out to be a broken egg action and the stock was stopped out from my portfolio. The close was with high volume, which also means that it was necessary to get out.
Results
- What went well?: Closing this decision was good in hindsight because the stock price kept falling; it eventually even broke below the 50-day moving average.
- Cause of Error / IMPROVE: I should have bought the stock already in April because at that time it was breaking out of the base. I did the tennis ball action play, which means that I bought when it bounced up from the 21-day exponential moving average. But also, it would always be better to buy when the stock is breaking out of the base.
- Lessons Learned: I don’t know if this is the case or not, but when I bought the stock, the volume was not very high. This means that maybe the price action wasn’t strong enough to buy the stock.
- Position ROI, %: -5.25%
- Position ROI (portfolio), %: -0.33%
- Position Open Time (trading days): 4
terms and definitions

Ever felt like trading lingo was designed just to keep amateurs out of the loop? Let’s simplify a couple of terms:
EMA 21 Calculates the 21-period exponential moving average, highlighting short-term trends.
SMA 50 Averages the price over 50 periods, showing medium-term trends without overemphasizing recent data.
SMA 200 Averages the price over 200 periods, revealing long-term trends by treating all data equally.
Pivot price is the optimal buy point of a stock is defined as the moment it transitions from a stable basing area or chart pattern and begins to achieve new highs in price.
Industry Rank Investor’s Business Daily’s system ranks industries 1 to 197 based on performance. It guides us in CAN SLIM TRADING towards leading sectors.
U/D Ratio Measures stocks closing up versus down. A ratio above 1.0 indicates bullish sentiment, important in CAN SLIM TRADING.
RS Rating Ranks a stock’s performance on a 1 to 99 scale. I look for at least 85, showing strong momentum and growth potential.
RS Line Compares stock price to the market, plotted as a ratio. We seek an uptrend, indicating outperformance and strong momentum.
Volatility Measures how much a security’s price fluctuates over time. High volatility means large price changes, indicating risk and potential reward.
Institutional Ownership Trend indicates whether the stock is under accumulation or distribution by the institutions.
EPS (Earnings Per Share): A financial metric calculated by dividing a company’s net profit by the number of its outstanding shares. It indicates the amount of profit attributed to each share of stock, serving as a key indicator of a company’s profitability.
one more thing
If you have any thoughts or questions about trading or investing, fill out the form here and I’ll get back to you.

