Curious about the secrets behind successful trading strategies? Today, I’ll take you through my VECO purchase, the ups, the downs, and all the juicy details. You’ll see how I navigated the market, managed risks, and aimed for maximum gains.
Initial Market Conditions
The overall stock market (NASDAQ and S&P 500) was in a solid uptrend. This gave me the confidence to dive into individual stocks. Did you know that 3 out of 4 stocks move in the same direction as the market? It’s true!
Both NASDAQ and S&P 500 were above their key moving averages: EMA 21, SMA 50, and of course, SMA 200. This alignment triggers CAN SLIM traders to buy stocks and increase positions. When major indices are above these moving averages, it signals a healthy market. And a healthy market means it’s time to seize opportunities!
The Initial Purchase
On May 7th, I bought VECO at $37.85. I set a stop-loss at $35.41 to manage risk. Why a stop-loss? Because certainty in the market is a myth. You can’t eliminate all risks.
Performance Metrics
VECO had an RS Rating of 92. This means it outperformed 92% of stocks. Impressive, right? The RS line was trending up, suggesting continued market leadership.
- RS Rating: 92
- Industry Rank: 37 out of 197
- Volume up/down ratio: 1.2
Institutional Involvement
Institutions were accumulating VECO. Their support makes stock prices less volatile. And, when institutions buy the dips, it’s a good sign.
Profit Targets and Risk Management
I set my first profit target at $45.42. This gave me a 1-to-3 risk/reward ratio. A solid setup for any trader.
- First profit target: $45.42
- Risk/reward ratio: 1-to-3
Second Purchase
By May 14th, VECO rose over 2%. This triggered a second buy at $38.84. The new stop-loss was tight at $37.86. And why so tight? Because I don’t hold big positions in declining stocks.
You see, a tight stop-loss helps limit potential losses. If the stock starts to slide, I want out quickly. Holding onto a losing position can be a quick way to drain your portfolio. So, setting a tight stop-loss at $37.86 was my way of protecting my investment. What’s the lesson here? Always have an exit plan.
Combined Position Analysis
These buys made VECO just over 10% of my portfolio. Normally, I don’t go higher. Why? Because anything can happen overnight.
Stocks can drop suddenly due to unforeseen events. Keeping VECO at 10% of my portfolio minimizes risk. Diversification is key. If one stock takes a hit, it won’t wipe out your entire portfolio. And, what’s next? Being prepared for the unexpected and staying flexible with your trading strategy.
details at a glance
Explanations for the Drawing
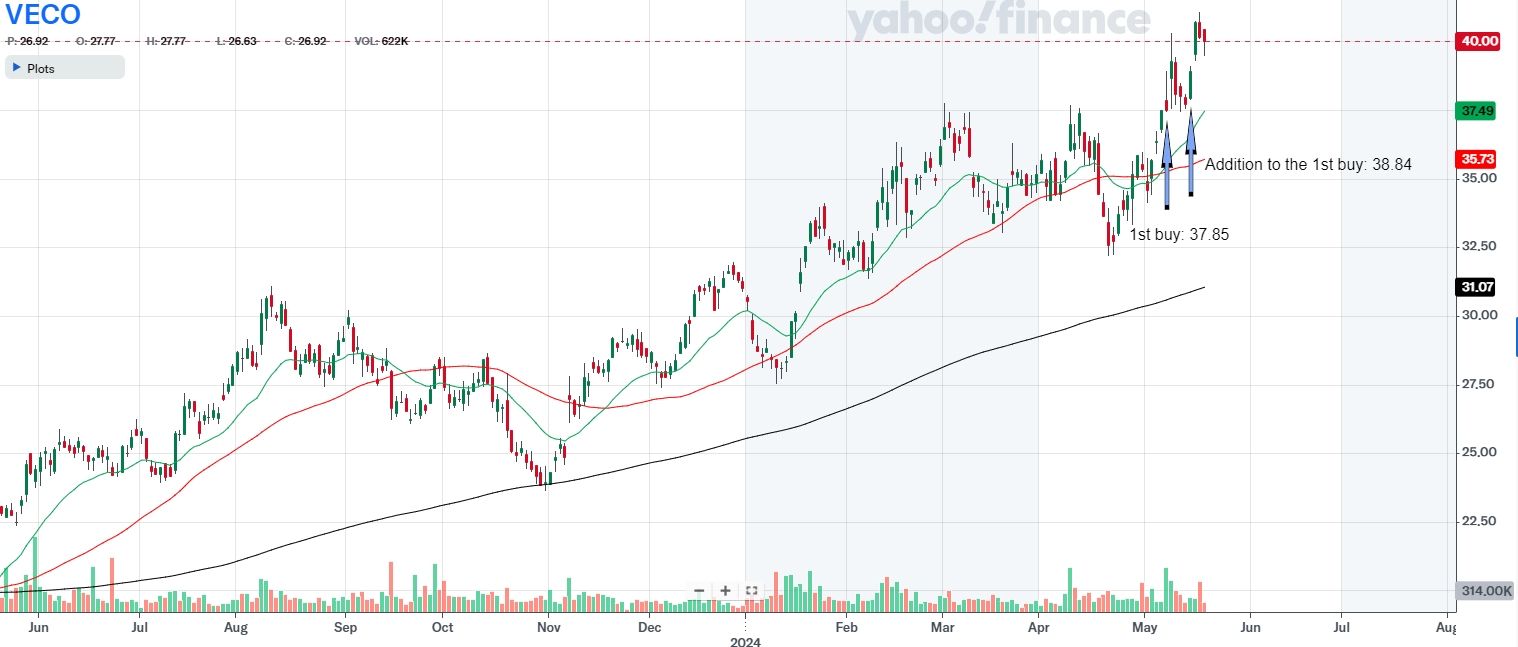
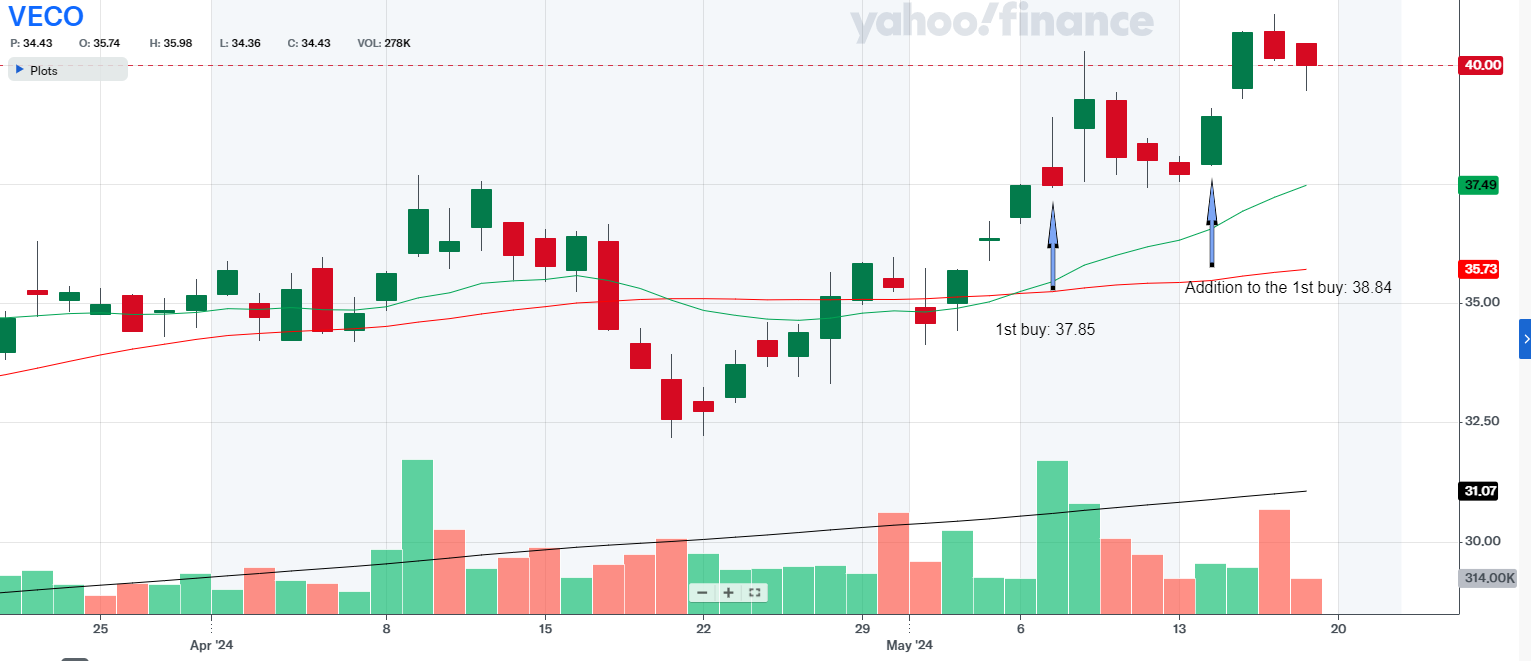
The upward purple arrow shows where I bought the stock. The downward purple arrow shows where I sold it.
Green Line 21-day exponential moving average line (see EMA 21 below)
Red Line 50-day simple moving average line (see SMA 50 below)
Black Line 200-day simple moving average line (see SMA 200 below)
Bigger picture of the stock price performance before and slightly after buying:

Detailed chart of the buying period:

1st buy
- Underlying: VECO
- Date: 7 May 2024
- Underlying Price: 37.85
- Stop Loss: 35.41
- Profit Target: 45.42
- Market Outlook: Confirmed uptrend
- RS Rating: 92
- RS Line Trend (U/N/D): U
- Industry Rank (X / 197): 37
- Volume U/D Ratio: 1.2
- Institutional Ownership Trend (U/N/D): U
- Position Risk, %: 6.39
- Position Risk to NL, %: 0.33
- Potential Profit (Position), %: 19.83
- Risk to Reward Ratio: 0.32
- Position Size, %: 5.19
- Why did I open this trade at that point? Stock was breaking out of a base (with not heavy volume). The price of the stock outperforms 92% of the overall market.
- Was it an ideal buy? YES
- Remarks: By the price pattern, I would consider it an ideal buy, but the stock is not CAN SLIM and the industry rank is not in the top 20 or top 10.
Addition
- Underlying: VECO
- Date: 14 May 2024
- Underlying Price: 38.84
- Stop Loss: 37.86
- Profit Target: 46.61
- Market Outlook: Confirmed uptrend
- RS Rating: 89
- RS Line Trend (U/N/D): U
- Industry Rank (X / 197): 30
- Volume U/D Ratio: 1.0
- Institutional Ownership Trend (U/N/D): U
- Position Risk, %: 2.50
- Position Risk to NL, %: 0.13
- Potential Profit (Position), %: 19.83
- Risk to Reward Ratio: 0.13
- Position Size, %: 5.33
- Why did I open this trade at that point? The initial position was in profit, so I added to the position. That’s why I opened it.
- Was it an ideal buy? No, the price was not breaking out of the base.
- Remarks: Since it’s a secondary or added position, I set the stop loss very tight. If the price of the stock falls, it will start liquidating automatically very soon.
Terms and definitions

Ever felt like trading lingo was designed just to keep amateurs out of the loop? Let’s simplify a couple of terms:
EMA 21 Calculates the 21-period exponential moving average, highlighting short-term trends.
SMA 50 Averages the price over 50 periods, showing medium-term trends without overemphasizing recent data.
SMA 200 Averages the price over 200 periods, revealing long-term trends by treating all data equally.
Industry Rank Investor’s Business Daily’s system that ranks industries 1 to 197 based on performance. It guides us in CAN SLIM TRADING towards leading sectors.
U/D Ratio Measures stocks closing up versus down. A ratio above 1.0 indicates bullish sentiment, important in CAN SLIM TRADING.
RS Rating Ranks a stock’s performance on a 1 to 99 scale. I look for at least 85, showing strong momentum and growth potential.
RS Line Compares stock price to the market, plotted as a ratio. We seek an uptrend, indicating outperformance and strong momentum.
Volatility Measures how much a security’s price fluctuates over time. High volatility means large price changes, indicating risk and potential reward.
Institutional Ownership Trend indicates whether the stock is under accumulation or distribution by the institutions.
EPS (Earnings Per Share): A financial metric calculated by dividing a company’s net profit by the number of its outstanding shares. It indicates the amount of profit attributed to each share of stock, serving as a key indicator of a company’s profitability.
Overhead Supply: is a stock market term for a large amount of unsold shares at a certain price level, acting as resistance that prevents the price from rising. It occurs when investors looking to sell at break-even points add to the supply, making it hard for the stock to increase in value until this excess is bought up.
Stage 1: Basing or Bottoming Stage
Definition: A period following a stock’s decline where it starts moving sideways, forming a base. This stage signifies the easing of downward pressure and the beginning of stabilization, indicating that the stock is not in an uptrend yet but is preparing for potential future growth.
Stage 2: Advancing or Uptrend Stage
Definition: The phase in which a stock breaks out of its base on significant volume, indicating a strong buying interest and the initiation of a new uptrend. This stage is considered the most opportune time for investors to purchase the stock, as it is expected to achieve substantial gains.
Stage 3: Top or Peaking Stage
Definition: A stage characterized by the stock beginning to exhibit signs of losing momentum after its upward movement. The stock may start to move sideways with increased volatility compared to Stage 1. This suggests the stock might be reaching its peak, and the existing uptrend could be weakening.
Stage 4: Declining or Downtrend Stage
Definition: This final stage occurs when the stock breaks down from its Stage 3 pattern and enters into a downtrend, marked by a sequence of lower lows and lower highs. It signifies that selling pressure has surpassed buying interest, usually serving as a signal for investors to sell the stock to mitigate further losses.
Conclusion

The VECO buy was a calculated decision influenced by market trends, performance metrics, and institutional support. By setting strategic stop-losses and profit targets, the position was managed with a keen eye on risk and reward. This approach exemplifies disciplined trading with a focus on minimizing losses and maximizing gains.
In trading, success isn’t about certainty; it’s about managing uncertainty with precision and foresight. Will VECO be the next big winner in your portfolio? Only time—and smart trading—will tell!
By the way, if you have any thoughts or questions, fill out the form here and I’ll get back to you.


