Ever wondered why savvy investors say, ‘Double down’ when a stock jumps just 2%? Let’s unpack the strategy behind this move, and why it might just be your smartest play yet.
Dive into the exciting world of stock trading with our story of a recent investment in NetApp (NTAP). What does it take to make an informed stock purchase? How do you protect your investment while aiming for high returns? Follow along as we break down a real-life trade, examining the decisions and strategies used to navigate the volatile market.
The Initial Purchase
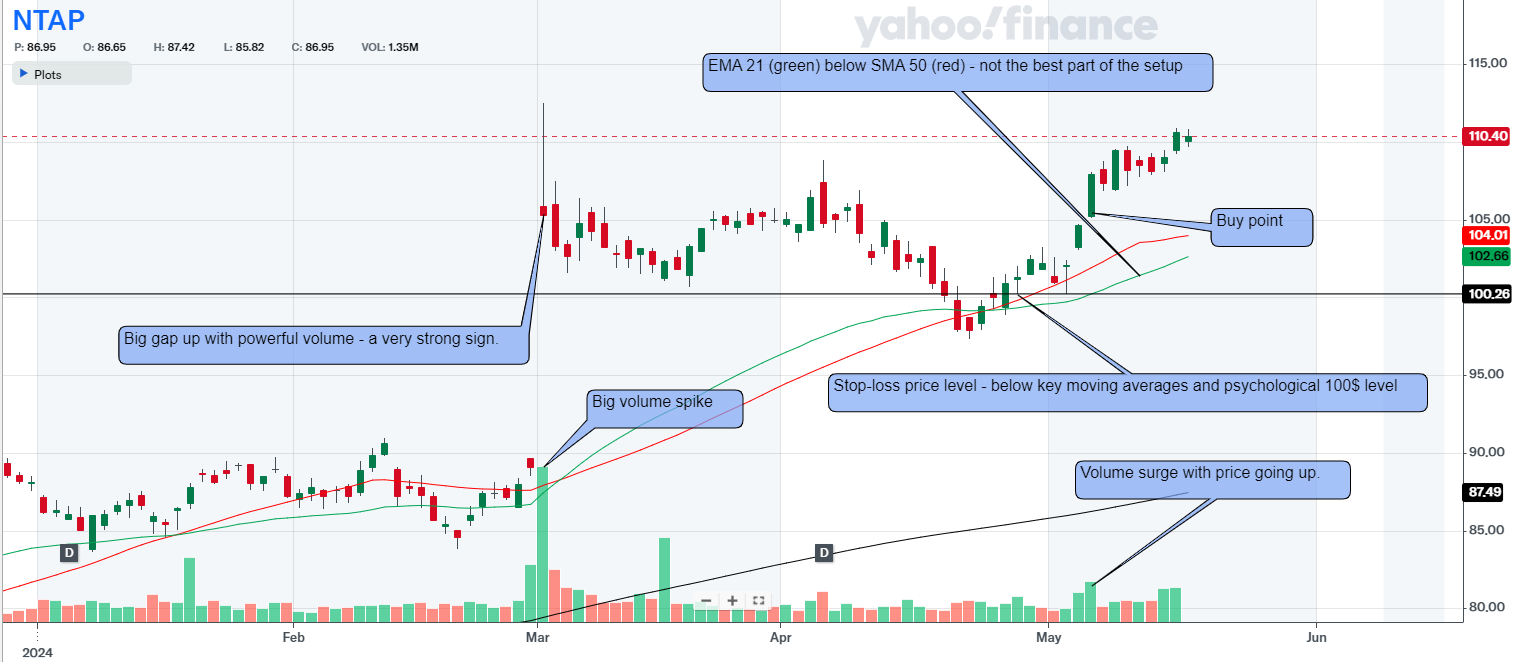
On a sunny May morning, I decided to buy shares of NetApp (NTAP) at $106.05 each. I chose to set my stop loss at $99.68, a strategic move to stay safe under the $100 mark and beneath the EMA 21 and SMA 50.
- Why below these levels? It’s all about safety. These moving averages act like a safety net, signaling when it might be time to cut losses.
- And the price? Buying at $106.05 might seem high, but there’s wisdom in buying high—it often means the stock is already on an upward trajectory.
The Follow-Up Strategy
Just two days later, the stock’s price had increased to $108.54. That’s when I decided to add to my position, adhering to my rule of enhancing my stake after a 2% gain.
- Why add more? This approach leverages the momentum. It’s like acknowledging the stock is on a winning streak and giving it more room to run.
- Portfolio balance is key. I make sure no single stock outweighs more than 10% of my portfolio to manage risk.
Understanding Market Signals
NetApp’s stock not only rose in price but also exhibited strong trading volume and a confirmed uptrend. These signals are vital cues for traders to consider.
- What do these signs tell us? They indicate robust investor interest and potential for further price increases.
- And how do they affect decisions? They provide confidence to hold or even increase your investment in a rising stock.
Risk Management and Decision Making
Trading is less about hunches and more about strategic decisions. Here’s how I handle my trades:
- Setting a profit target: For NTAP, my target was $127.25, aiming for a 1:3 risk/reward ratio.
- When to sell? Typically, I sell when the profit target is hit. But if the stock jumps 20% in less than two weeks, I’ll hold it for at least eight weeks to capture further gains.
Details at a Glance
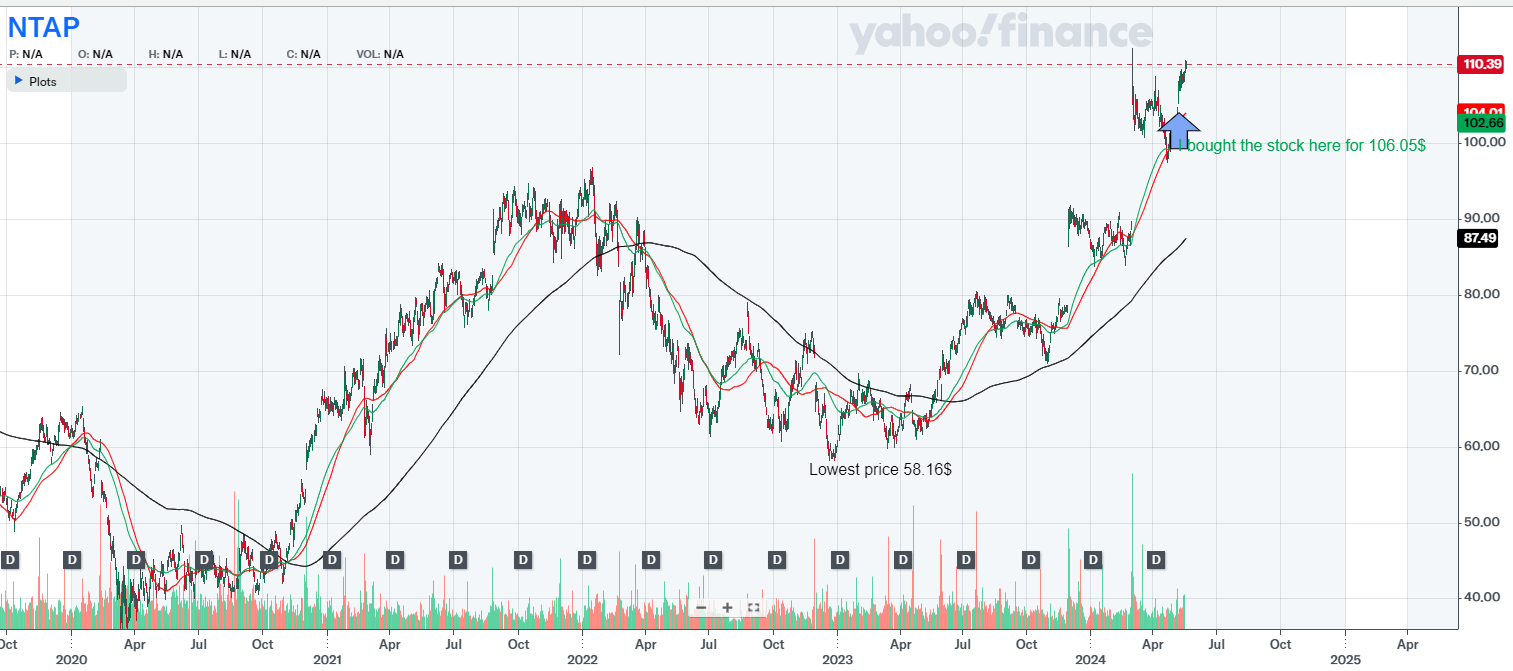
Explanations for the Drawing: The upward purple arrow shows where I bought the stock.
Green Line 21-day exponential moving average line (see EMA 21 below)
Red Line 50-day simple moving average line (see SMA 50 below)
Black Line 200-day simple moving average line (see SMA 200 below)

As you can see from the drawing above I bought the stock at a very high price. Down below is a more detailed chart with an analysis of the buying decision:

- Initial buy price: $106.05
- Follow-up buy price: $108.54
- Profit target: $127.25
- Stop loss: Initially at $99.68, adjusted to $105.97
- Key strategy: Buy high and add on a 2% increase
Terms and Definitions

EMA 21 Calculates the 21-period exponential moving average, highlighting short-term trends.
SMA 50 Averages the price over 50 periods, showing medium-term trends without overemphasizing recent data.
SMA 200 Averages the price over 200 periods, revealing long-term trends by treating all data equally.
Pivot price is the optimal buy point of a stock is defined as the moment it transitions from a stable basing area or chart pattern and begins to achieve new highs in price.
Industry Rank Investor’s Business Daily’s system that ranks industries 1 to 197 based on performance. It guides us in CAN SLIM TRADING towards leading sectors.
U/D Ratio Measures stocks closing up versus down. A ratio above 1.0 indicates bullish sentiment, important in CAN SLIM TRADING.
RS Rating Ranks a stock’s performance on a 1 to 99 scale. I look for at least 85, showing strong momentum and growth potential.
RS Line Compares stock price to the market, plotted as a ratio. We seek an uptrend, indicating outperformance and strong momentum.
Volatility Measures how much a security’s price fluctuates over time. High volatility means large price changes, indicating risk and potential reward.
Institutional Ownership Trend indicates whether the stock is under accumulation or distribution by the institutions.
EPS (Earnings Per Share): A financial metric calculated by dividing a company’s net profit by the number of its outstanding shares. It indicates the amount of profit attributed to each share of stock, serving as a key indicator of a company’s profitability.
Conclusion
Through strategic purchases and vigilant risk management, trading can be less of a gamble and more of a calculated move. Whether you’re scaling up on a winning stock or setting stringent stop losses, the key is to stay disciplined and informed.


